Roger Caiazza
The major concerns for any net-zero transition program are the effects on reliability and affordability. On March 25, 2022 an article of mine was posted: New York Climate Act: What the Experts are Saying Now that explained why the experts responsible for the reliability of the New York electric grid are concerned about the mandated transition to a “zero-emissions” electric grid by 2040. This post addresses affordability showing that the costs presented in the plan for the transition are mis-leading at best.
Background
New York’s Climate Leadership and Community Protection Act (Climate Act) was passed in 2019 and became effective on 1/1/2020. The Climate Action Council has been working since then to develop plans to implement the Act. Over the summer of 2021 the New York State Energy Research & Development Authority (NYSERDA) and its consultant Energy + Environmental Economics (E3) prepared an Integration Analysis to “estimate the economy-wide benefits, costs, and GHG emissions reductions associated with pathways that achieve the Climate Act GHG emission limits and carbon neutrality goal”. Three Integration Analysis implementation strategies were incorporated into the Draft Scoping Plan when it was released for public comment at the end of 2021. These scenarios include different policy options to meet and exceed the Climate Act targets.
My last post highlighted results shown in a draft presentation at a New York Independent System Operator (NYISO) meeting about an analysis being done to project the amount and type of generating capacity needed to transition the New York electric grid to “zero-emissions” by 2040. The experts at the meeting are concerned because “Some scenarios do not represent realistic system performance” and the total projected wind, solar, energy storage and “dispatchable emissions-free resources” capacity additions projected are on the order of double the total current capacity. The 2021-2030 Comprehensive Reliability Plan report concludes “While there are hundreds of projects in the NYISO interconnection queue, there are none that would be capable of providing dispatchable emission-free resources that could perform on a multi-day period to maintain bulk power system reliability. Such resources are not yet widely commercially available.” That resource alone is greater than the total existing capacity so there certainly are reliability concerns.
A couple of weeks ago I posted an article on my blog showing an egregious example of hiding the true costs of the Scoping Plan. While I was drafting an overview presentation on the Draft Scoping Plan for my state Senator, I took another look at information supporting the assertion that the “cost of inaction exceeds the cost of action by more than $90 billion”. I realized my concerns with the cost projections could be more clearly explained using the figures in Draft Scoping Plan Appendix G: Integration Analysis Technical Supplement Section I (Appendix G). This post is the result.
Benefits and Costs Summary
Appendix G Figure 51. Net Present Value of Benefits and Costs relative to Reference Case, Including GHG benefits, Health Benefits, and Net Direct Costs (2020 – 2050) on page 69 is the primary documentation for the assertion that the “cost of inaction exceeds the cost of action by more than $90 billion”. Note that three scenarios are shown: “Strategic use of low carbon fuels”, “Accelerated transition away from combustion”, and “Beyond 85% Reductions”. This net-zero program plans to reduce greenhouse gas emissions by 85% and then offset the remaining 15% to get to “net-zero”. The $90 billion number is the net benefit difference between the net system costs and the total benefits. My first impression was that these numbers represented the total costs for New York State to meet the net-zero mandate. I should have known better.
Unpacking the title: the numbers are the “net present values”. According to the Draft Scoping Plan
the integration analysis included calculations for three cost metrics: net present value (NPV) of net direct costs, annual net direct costs, and system expenditures. The Plan defines NPV of Net Direct Costs as the levelized costs in a given scenario incremental to the Reference Case from 2020 through 2050 using a discount rate of 3.6% and including incremental direct capital, investment, operating expenses, and fuel expenditures. The annual Net Direct Costs are defined as the levelized costs in a given scenario incremental to the Reference Case for a single year snapshot and include incremental direct capital
investment, operating expenses, and fuel expenditures. I don’t have the background to comment on the impact of these definitions relative to the acceptability of the projections.

System Expenditures
System Expenditures are defined as an estimate of absolute direct costs (not relative to the Reference Case) and do not reflect direct costs in some sectors that are represented with incremental costs only. Appendix G Figure 48, New Present Value of System Expenditures in Reference Case and Scenarios 2-4 (2020-2050) shown below describes these costs.
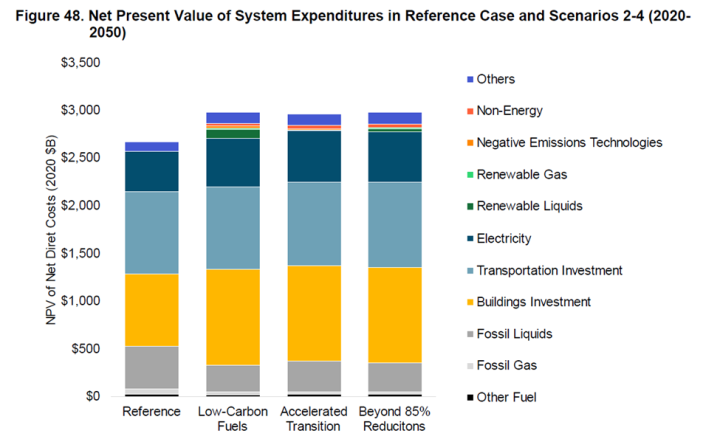
An important aside: the Climate Act requires the Climate Action Council to “[e]valuate, using the best available economic models, emission estimation techniques and other scientific methods, the total potential costs and potential economic and non-economic benefits of the plan for reducing greenhouse gases, and make such evaluation publicly available” in the Scoping Plan. This figure and the others included represent most of the cost documentation. For example, the component costs in the reference case in this figure are not included in any supporting documentation. There are spreadsheets that document other figures in the Draft Scoping Plan with the data tables used to generate the figures but I have been unable to find this information for any of the cost figures. I submit that the Council has not fulfilled this requirement.
Figure 51 notes that the values listed are relative to the Reference Case. Figure 48 is important because other than a text mention that the Reference Case is $2.7 trillion, it is the only documentation for Reference Case values. It looks like the scenarios are all approximately $3 trillion consistent with the difference relative to the Reference Case ~$300 billion costs in Figure 51.
In my recent article looking at this issue I described what was included in the Reference Case. I searched the Draft Scoping Plan and the technical supplements for the phrase “Reference Case” for the analysis. The best description of the Reference Case contents was in Appendix G, Section I on page 12 in a footnote for Figure 4: Gross Greenhouse Gas Emissions by Mitigation Scenario:
The Reference Case is used for evaluating incremental societal costs and benefits of GHG emissions mitigation. The Reference Case includes a business as usual forecast plus implemented policies, including but not limited to federal appliance standards, energy efficiency achieved by funded programs (Housing and Community Renewal, New York Power Authority, Department of Public Service, Long Island Power Authority, NYSERDA Clean Energy Fund), funded building electrification, national Corporate Average Fuel Economy standards, a statewide Zero-emission vehicle mandate, and a statewide Clean Energy Standard including technology carveouts. For more details see Chapter 5.3.
If the documentation included a cost component breakdown that would enable readers to determine whether the reference case is a reasonable estimate of the costs without the Climate Act. In my opinion many of those programs should not be in the Reference Case. Looking at the bar chart the four biggest cost components are electricity, transportation investment, buildings investment and fossil liquids. Note that the transportation investment (~700 billion) does not vary much between the four bars. Keep that in mind.
Costs Relative to Reference Case
Appendix G Figure 47 lists the NPV of net direct costs relative to the reference case. This illustrates what is meant by the net direct costs label. In each of the mitigation scenarios there are avoided fossil fuel expenditures that are subtracted from the total costs of the implementation strategies to get the ~$300 billion net direct costs.
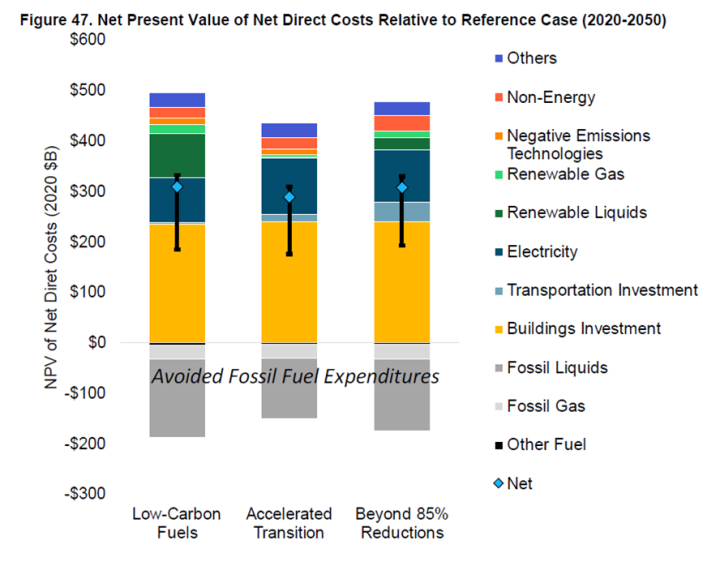
Note that the transportation investments listed are no more than $30 billion for the scenario, Beyond 85%”, with the highest costs. My original impression of Figure 51 was that it represented all the costs necessary for New York to get to net-zero. Clearly $30 billion is nowhere near the cost to replace all the approximately 10 million vehicles in New York with electric vehicles that use batteries or fuel cells even if the cost differential was $3,000. The total cost has to be higher to include the cost for personal electric charging stations or public electric chargers, at least.
I think that the true cost to electrify New York transportation is shown in Figure 48. The system expenditures listed suggest the transportation investment component cost is around $700 billion which makes more sense. The justification to put those costs in the Reference case is a bit of semantic sleight of hand based on the footnote that says that the Reference Case includes a “business as usual forecast plus implemented policies”. It is true that New York passed legislation setting a goal for all new passenger cars and trucks sold in New York State to be zero-emissions by 2035 in April 2021 so the Scoping Plan is consistent with the only explanation of the Reference Case components.
However, suggesting that this “implemented policy” should not be included in the Climate Act implementation costs is disingenuous. The press release announcing that the Governor signed the legislation states: “The actions announced today in advance of Climate Week 2021 support New York’s ambitious goal of reducing greenhouse gas emissions by 85 percent by 2050, as outlined in the Climate Leadership and Community Protection Act.” It goes on to quote Governor Hochul: “New York is implementing the nation’s most aggressive plan to reduce the greenhouse gas emissions affecting our climate and to reach our ambitious goals, we must reduce emissions from the transportation sector, currently the largest source of the state’s climate pollution”. I think that these statements pretty well represent any dispassionate observer’s belief that the only reason for the law is to support the Climate Act. As such those are not legitimate Reference Cases costs.
Conclusion
The major concerns for any net-zero transition program should be the effects on reliability and affordability. It is not in the best interests of society to implement a policy that does more harm than good. Ultimately the underlying problem for the Texas Energy Debacle of February 2021 was poor reliability planning. As mentioned here, the rush to implement an energy policy that depends on a non-existent dispatchable emissions-free resources technology surely increases the possibility of a similar blackout in New York. This post shows that the total costs for the New York energy system (2020-2050) are on the order of $3 trillion but that the costs attributable to the Climate Act are subject to interpretation. The affordability comparison of costs and benefits is strongly affected by that interpretation.
Appendix G Figure 51: Net Present Value of Benefits and Costs relative to Reference Case shows that costs relative to the Reference Case are on the order of $300 billion and that benefits are on the order of $400 billion to justify the claim that the “cost of inaction exceeds the cost of action by more than $90 billion”. The Draft Scoping Plan claimed that vehicle electrification costs should be included in the Reference Case because the electric vehicle legislative mandate was an “implemented policy”. However, the $700 billion costs to electrify the transportation investment component of Figure 48 system expenditures are a necessary cost for the net-zero transition and should not be included in the Reference Case. Clearly those costs are a necessary transition expense. If those costs are moved from the Reference Case to the mitigation scenarios where they belong, the costs are much greater than the benefits.
The Draft Scoping Plan was written to prove the desired conclusion that the benefits were greater than the costs. In order to make that case both benefits and cost estimates have been perverted. I have shown elsewhere that the benefits are uniformly exaggerated and the largest benefit is dependent upon an incorrect application of the social cost of carbon. The cost estimates are inadequately documented and, as shown here, a semantic trick was used to claim that the cost to de-carbonize transportation was claimed to be “business as usual” because the electric vehicle conversion legislation was already “implemented”.
—————————————————————————————————————————————
Roger Caiazza blogs on New York energy and environmental issues at Pragmatic Environmentalist of New York. More details on the Climate Leadership & Community Protection Act are available here. This represents his opinion and not the opinion of any of his previous employers or any other company with which he has been associated.