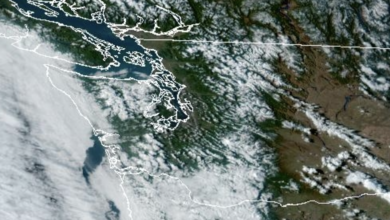
A very large, intense, and beautiful cyclone was off our shore yesterday afternoon (see below). Stretching over several thousand miles, this cyclone was associated with active weather fronts, very strong winds, and powerful vertical motions.
.gif)
But there is a lot with such storms that can surprise the uninitiated.
For example, where are the strongest winds? If you said in the very center of the storm, where the lowest pressure is observed, you would be wrong. And there are many more surprises.
Consider the winds.
Below is a short-term forecast map of sea level pressure and surface winds (below). The solid lines are isobars (lines of constant sea level pressure) and you can see an impressive low center of 968 hPa. That is quite low for this latitude.
But now look at the wind speeds (sustained not gusts) shown by the color shading. The winds are actually quite weak in the center of the low, but very strong to the west and southwest (some winds over 55 knots).

But why there? Why not where the pressure is lowest?
Because winds are closely associated with pressure differences (horizontal pressure gradients) and those are greatest to the west and southwest of oceanic low centers.
Below is a blow-up of the sea level pressures at the same time. Note the intense pressure differences to the southwest and west of the low center. These pressure differences or pressure gradients drive the strong winds. The pressure differences are weak in the center of the storm where the pressure is lowest.

I suspect I know your next question. Why are the pressure differences largest to the southwest to west to northwest of the low center?
Good question. The answer has to do with temperature. Look again at the figure above. The color shading shows the temperature at around 800 meters above sea level (925 hPa pressure), with blue being the coldest and orange the warmest.
The low center is drawing in cold air from the north and warm air from the south. The greatest temperature contrasts are to the northwest and west of the low since this area has access to the primo cold air to the north.
Temperature contrasts produce pressure contrasts since warm air is less dense (heavy) than cold air.
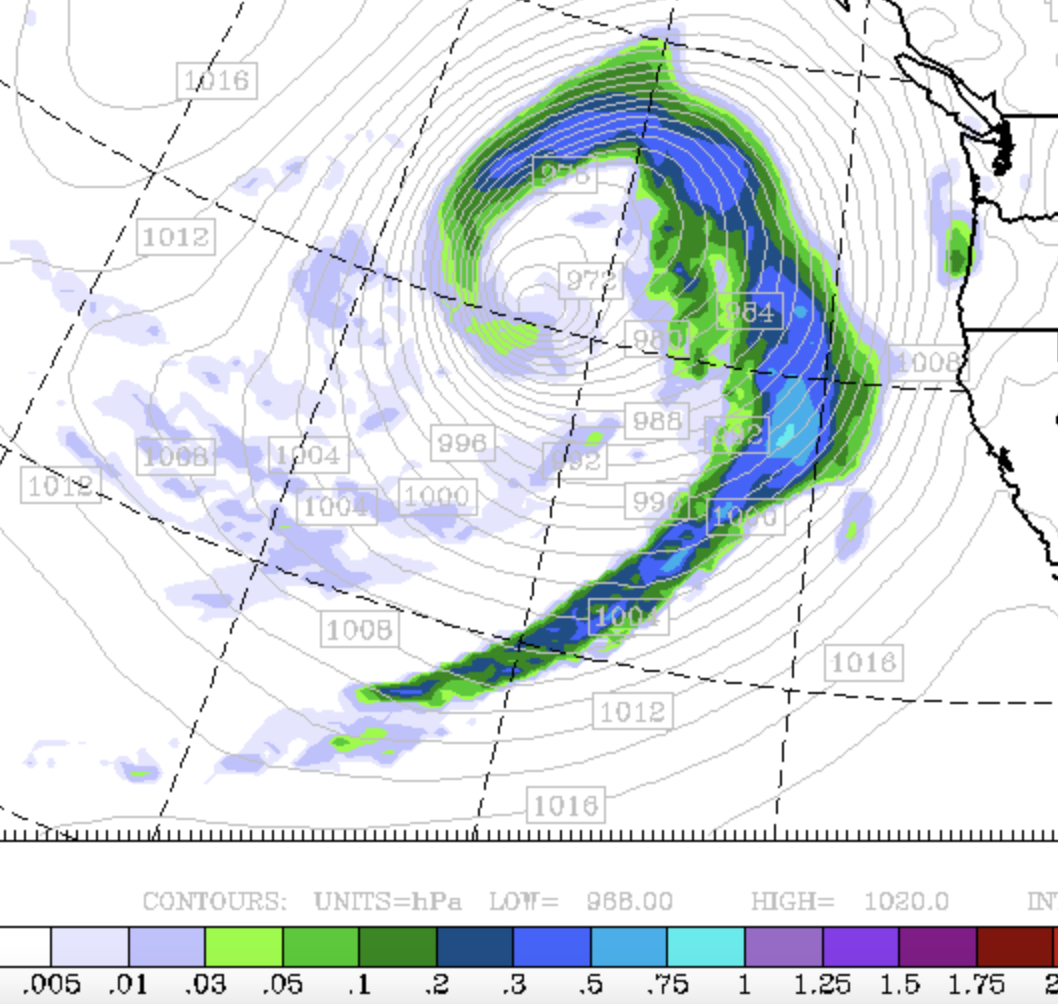
Finally, where do you think the heaviest precipitation is found in such an intense storm? Near the lowest pressure?
Nope. Below are the predicted 3-h precipitation totals at the same time as the maps above.
Not much precipitation near the low center, but a LOT from the northeast to east to southeast.
Why? Because that is where the strongest upward motion is found and upward motion is necessary to get precipitation. This is where moist air is forced to rise by the air motions associated with the storm. More on this in a future blog.
In summary, Pacific and midlatitude cyclones are very complex animals, ones we have only understood properly in recent years, mainly due to our ability to simulate their three-dimensional structures.