Is Northwest Precipitation Getting Heavier or Lighter?

The media frequently talks about trends in precipitation, sometimes describing increasing drought and sometimes suggesting precipitation is increasing.
Of interest, both increasing drought and increasing precipitation are often “explained” by global warming.
In any case, instead of speculating about precipitation trends, let’s check out what the real world is telling us.
That is the topic of this blog.
Let’s start with Seattle-Tacoma Airport, Washington, whose record goes back to the mid-1940s. Below is a plot of its annual precipitation. There is little overall trend. A bit wetter during the early and later periods perhaps, with an average of around 39 inches. There is no real trend in magnitude of the extremely wet years.
Pretty much the same thing for the wet season (Oct 1- 30 March) when the bulk of Seattle’s annual precipitation falls. The cool-season average is about 30 inches.
In contrast, there has been a modest drying during the summer (June through August), with warm-season totals dropping from roughly 3.8 to 2.9 inches. Much of this trend is due to fewer extremely wet summers.
Olympia is similar (I checked).
What about Eastern Washington?
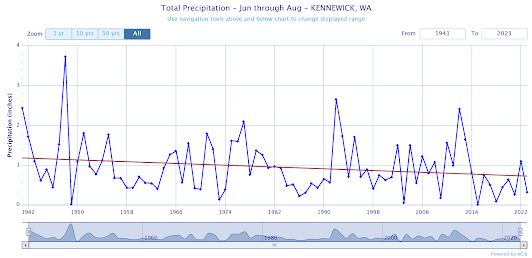
Let’s check out Kennewick in the Tri-Cities, right in the middle of the Columbia Basin.
For the annual precipitation, very little trend (with an average of about 7.5 inches per year). No real trend in extremes.
Winter precipitation at Kennewick has very little trend.
Summers in Kennewick have become a bit drier, dropping from roughly 1.2 inches to about 0.75 inches
It is also possible to plot the average precipitation over the entire State of Washington, using the NOAA/NWS climate division data. Using this dataset the annual average precipitation is shown below, starting in 1950. No significant trend.
In summary, there is a robust message in all this, one confirmed by other stations I have not shown: during the past 70 years or so, total annual precipitation in our region has hardly changed. Winters have hardly changed. And summers have gotten slightly drier…but summers don’t contribute much to the annual totals since they are typically quite dry.
So if annual and seasonal values have changed little during the past half-century or so, what about short-term extremes, such as those produced by atmospheric rivers?
Let’s examine that using daily precipitation data. I found the top 30 two-day precipitation events at SeaTac Airport and then removed duplicate events (adjacent days sharing the same precipitation). That left 21 events. Below is a plot of these events over time (from 1951 to this year). The highest values ranged from roughly 3.5 inches to 5.25 inches over two days.
There is no evidence for an upward (or downward) trend in the heaviest precipitation events.
So if the heaviest precipitation events are not getting more intense, are they getting more frequent?
To answer that question, here is a plot of the frequency of the heavy precipitation events at SeaTac over time. Heavy events were particularly frequent from the mid-1990s to around 2011, and then lessened in frequency, followed by several events during the past two years.
Looking over the 70-year period, there has been an increase in frequency during the later half, but there is a lot of shorter-period variability. I published a paper on this issue about a decade ago with similar findings.
Could global warming be contributing to this increase in frequency but not in intensity? It is possible. I will talk about this issue more in a future blog.
Finally, with the recent rains, the Seattle water supply situation is back to normal. Reservoir storage is at average (see below)


