The Week That Was: 2022-05-14 (May 14, 2022)
Brought to You by SEPP (www.SEPP.org)
The Science and Environmental Policy Project
Quote of the Week: “It is the facts that matter, not the proofs. Physics can progress without the proofs, but we can’t go on without the facts.” – Richard Feynman
Number of the Week: 2°F every half-hour
THIS WEEK:
By Ken Haapala, President, Science and Environmental Policy Project (SEPP)
Scope: Ecologist Jim Steele presented new video on the influence of ENSO (El Niño Southern Oscillation) on earth’s temperatures, including the Arctic. It amplifies his first video in the series “The Big 5 Natural Causes of Climate Change.” The first video was on the Atlantic Multidecadal Oscillation (AMO). These natural variations are largely ignored by the global climate modelers, the UN Intergovernmental Panel on Climate Change (IPCC), and its followers in western governments. As such, the climate models have become more instruments for persuasion, rather than illumination or understanding. Using them for policy is economically destructive.
More than ten years after the successful first effort, Anthony Watts announced another effort to expose the shoddy state of NOAA’s instruments for recording surface temperatures. He is asking volunteers to photograph current stations to “find out what has changed, and how many stations have actually closed, gotten better, or gotten worse.”
David Burton, who was an expert reviewer for Working Group 1: The Physical Science Basis of IPCC Sixth Assessment Report (AR6, 2021), reports the way the central planners of the IPCC keep the expert reviewers informed. It is an authoritarian system in its fullest.
Last October 31 to November 12, we had the 26th United Nations Climate Change Conference, held in Glasgow, Scotland, United Kingdom, commonly referred to as COP-26. This May we had the United Nations Convention to Combat Desertification (UNCCD), discussed below. The theme is the same: the world is getting worse due to the use of fossil fuels. The UN-CCD non-science has the same bias as the UN-IPCC, ignore contradicting evidence! Can the UN issue a truly honest report?
An author of many books on energy, Vaclav Smil, offers reasons why we cannot rely on the magical (or delusional) thinking that was exhibited at COP-26. Fossil fuels are needed by humanity. Using current technology, wind and solar power cannot replace them.
********************
Warming the Arctic: In Part 3 of “The Big 5 Natural Causes of Climate Change: How La Niña Warms the World,” Ecologist Jim Steele builds on Part 1, Varying Atlantic Water Transport. In the earlier presentation Steele establishes that
“Jonathan Kahl’s analysis of Arctic surveys between 1950 and 1990 & published in the pre-eminent journal Nature, found no rise in arctic air temperatures.
But after the 1990 shift of the Arctic Oscillation, which caused sub-freezing winds from Siberia to blow insulating arctic sea ice out of the Arctic, arctic air temperatures suddenly began warming several times faster than the global average temperature.
The loss of insulating sea ice increased the ventilation of stored ocean heat, warming the air but cooling the ocean. That warming offset, and obscured, the 25-year winter cooling trend in both North America and Eurasia, … Clearly Arctic warming was due to regional climate dynamics, not global.
From Danish sea ice records and modern satellite photos, we see two distinct periods with very similar reductions in the extent of arctic sea ice. One during the 1930s and one since 2000. Those 2 periods of reduced sea ice are separated by an intervening 30-year period of increasing sea ice, suggesting sea ice is modulated by a natural oscillation.
“The Atlantic Multidecadal Oscillation [AMO] represents a natural cyclical dynamic where the northern Atlantic waters alternate between becoming warmer than the southern Atlantic and then become cooler.
“It cycles approximately every 60 years.”
After showing graphs of temperature trends of the AMO between 1880 to 2010, Steele explains:
The decades with 0.3 to 0.5 degrees Celsius warmer north Atlantic waters coincide with the decades of reduced Arctic sea ice and rising global temperatures.
The decades between the 1950s to 1990s, when the north Atlantic’s temperatures were 0.3 to 0.5 degrees Celsius cooler, Arctic sea ice increased and there was no global warming trend.
As climate scientist Moreno-Chammaro published in 2020, these alternating periods of warmer and cooler north Atlantic temperatures also correlated with changes in the Intertropical Convergence Zone or ITCZ
The ITCZ is a migrating band of rising air, that sailors called the doldrums, which also brings heavy rainfall. Over Asia and Africa, the ITCZ follows the sun to the Tropic of Cancer or Tropic of Capricorn according to each hemisphere’s summer solstice.
The ITCZ is also the driver of the earth’s Hadley Circulation that constantly transports warmth and moisture from the tropics towards the poles.
Where the north and south trade winds converge defines the ITCZ’s position and determines where the rising branch of moist air of the Hadley Circulation will create a rainy season. Because the ITCZ determines the location of tropical rainy seasons, it leaves strong clues to how its location has changed over centuries and millennia.
Around 30 degrees north and south of the equator, the air moving towards the poles at the top of the atmosphere converges with upper atmospheric winds that are moving back toward the equator. This upper air convergence drives air currents downward to create a quasi-permanent high-pressure region at the surface.
Around 60 degrees north and south, the convergence of opposing surface air currents drives air upwards producing a quasi-permanent low-pressure region.
As the ITCZ migrates north and south, so do these inter-connected high- and low-pressure systems.
As illustrated by Zou’s 2014 research, during the Little Ice Age as the ITCZ migrated southward, so did its associated pressure systems. Its more southerly location caused warm equatorial currents to be deflected southward by the point of Brazil.
The southward migration of the associated north Atlantic pressure systems also steered warm gulf stream waters more eastward, reducing warm water flows into the Arctic, resulting in cooler temperatures that enabled the greatest Arctic sea ice buildup in 6000 years.
When solar irradiance increased, marking the end of the Little Ice Age, the ITCZ and associated pressure systems all migrated northward.
Now, the more northerly location of the ITCZ guided more warm tropical waters north of the point of Brazil causing more warm water to flow across the equator and feed more warm water into the gulf stream.
Additionally, the northward shifting north Atlantic pressure systems increasingly drove more warm gulf stream waters into the Arctic, which reduced arctic sea ice.
Changes in solar irradiance and sunspot cycles correlate with that migration of the ITCZ. Three sunspot minimums and reduced solar irradiance occurred during the Little Ice Age and correlates with the ITCZ southward migration.
The increasing solar irradiance since the end of the little ice age correlates with the northward migrating ITCZ and our current warming trend.
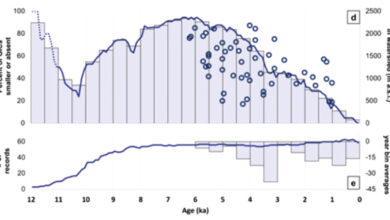
TWTW reminds readers that “Nature, Not Human Activity, Rules the Climate” showed the importance of solar influence in changing the ITCZ (pp 11-13). This section discusses the Svensmark Hypothesis using the example of proxies of C-14 (indicating solar activity) and O-18 (indicating temperature) from a cave in Oman from about 8300 to 7900 years before the present. These proxies are but one of a number of examples. The correlation is unusually strong.
Steele goes on to explain that as Arctic sea ice thins, its insolation properties are reduced, and the Arctic ventilates much more heat than radiated by humanity adding CO2. Three-meter-thick ice can ventilate about 5 times more heat than humanity adds, one-meter-thick ice about 15 times more heat. After explaining that the climate modelers with NASA-GISS ignore the changing AMO, Steele concludes:
“Changes in natural climate dynamics firmly dispute alarmists’ claims of a rapidly approaching CO2 driven climate crisis.
“1. Increasing arctic temperatures are chiefly caused by ventilating stored heat that warms the air but cools the ocean.
“2. The lowest solar irradiance in 100 years (sunspot cycle 24) suggests further cooling of the North Atlantic.
“3. Declining solar irradiance suggests a southward migrating ITCZ causing less northward transport of tropical heat.
“4. The coinciding shift of the Atlantic Multidecadal Oscillation further suggests cooler north Atlantic waters entering the Arctic in coming decades, and that would predict that as older Atlantic water circulating in the Arctic for 30 years finally cools, conditions would allow Arctic sea ice to recover.
“5. Finally, because most climate models and leading climate scientists incorrectly attributed rising CO2 to the North Atlantic Oscillation’s shift to its positive phase, their alarmist crisis claims should be viewed with a great amount of skepticism.”
In Part 3, Steele explains how the ENSO (El Niño Southern Oscillation) affects earth’s temperatures, including the Arctic. He begins:
“La Niñas promote clear skies over the eastern Pacific increasing solar heating. As a result, the eastern Pacific absorbs over 100 watts per meter squared more solar energy than it releases back to space. A similar but smaller energy imbalance occurs in the eastern Atlantic during Atlantic Niñas
“The blue regions [in a map not shown here] release more energy back to space than their surfaces absorbed. That excess energy was initially absorbed and transported from the tropics. Climate scientists agree any imbalance between the earth’s absorption and release of energy can cause climate change.
“However, the question is how much of that imbalance is caused by ocean dynamics vs increasing CO2 concentrations
“In all peer-reviewed research the world’s energy budget is measured in terms of watts, the flow energy per second. For example, a burning candle emits 80 watts. But step just one meter away from that candle and you will not feel its heat. So, to express the effects of heat energy, heat is measured in the amount of watts reaching a square meter of surface area, or watts per meter squared.
“On average, the earth’s atmosphere and surfaces absorb 240 watts per meter squared of solar energy.
“Claims of a climate crisis, are based on the belief that CO2 is causing the earth to retain just one more watt of solar energy than it releases back to space.”
After a lengthy discussion of how El Niños and La Niñas (the ENSO) work and vary with the changing Pacific Decadal Oscillation (PDO), Steele brings up that the Indian Ocean is the hottest ocean and:
“Higher sea levels in the western Pacific during La Niñas help push warm pool waters into the Indian Ocean. A portion of those waters are further heated in the Indian Ocean, which then get transported around southern Africa into the Atlantic – a dynamic referred to as the Agulhas leakage.”
[The Agulhas Current is a narrow, swift, and strong current flowing southward along the western edge of the Indian Ocean until it meets the strong eastward current from the Atlantic south of Africa.]
“Recent studies have detailed the pathway of Agulhas Leakage water into the Arctic
“First across the southern Atlantic, then across northern Brazil’s coast and into the Caribbean, then up the east coast of North America and into the Arctic – linking La Niña warming to Arctic sea ice fluctuations.
“Oscillations in the Agulhas Leakage correlate with the Atlantic Multidecadal Oscillation, which correlates with lost Arctic sea ice, as detailed in part one of this series. That lost ice allowed more stored Arctic heat to ventilate and increase the global temperature much like the ventilation of deep warm pool waters also raises global temperatures.
“As [James] Hansen unintentionally predicted in 2006: ‘other combinations’ such as discussed here, the transport of solar heated waters [are further] heated by more frequent La Niña events, can yield alternative causes that explain a comparable warming.”
In his discussion of how climate modelers ignore the ENSO, Steele brings up the 2005 paper in AAAS Science by James Hansen et al. on Earth’s Energy Imbalance based on a study of climate on Venus. The co-authors include Gavin Schmidt and other advocates of a false “climate crisis.” Venus is entirely inappropriate for study because it is lifeless and devoid of water. As Steele states:
“So naturally his analyses and models of climate change are typically focused on greenhouse gases that affected Venus.”
Further, as Howard Hayden explains in Basic Climate Physics # 3.
The clue to the fundamental physics error in the statement to the right [that “a hotter planet radiates more heat to outer space] is to be found in IPCC’s First Assessment Report (FAR 1990), which said
“Firstly, the mean temperature of the Earth’s surface is already warmer by about 33°C (assuming the same reflectivity of the Earth than it would be if the natural greenhouse gases [GHG] were not present.”
“Translation: Given the assumption that the reflectivity (albedo) of the earth is constant, the hypothetical non-GHG planet absorbs precisely the same amount of heat from the sun as the earth does now and radiates that same amount into space. The surface is 33ºC warmer than that hypothetical non-GHG earth, but our hotter planet radiates precisely the same amount of energy to space.
“For a second example, consider Venus. The surface is hot enough to melt lead, but because of its very high albedo of 75%, the planet absorbs 156 W/m2 from the sun and emits 156 W/m2 to space, versus our 239 W/m2. In this case, the hotter planet radiates less energy to space.
QED!” [Boldface italics in original]
Ancient astronomers considered Venus the brightest star in the sky. It is not that it produces light, but it reflects so much light from the sun! See links under Challenging the Orthodoxy – NIPCC, Challenging the Orthodoxy, and http://www.sepp.org/science_papers/Climate%20Physics%203.pdf
********************
Volunteers Needed: Anthony Watts requested volunteers to find out what has changed, and how many stations in NOAA’s Cooperative Observer Network, and specifically its subset network the U.S. Historical Climatological Network (USHCN) have actually closed, gotten better, or gotten worse. He needs photos and locations for specific stations, which he lists. See link under Challenging the Orthodoxy.
********************
In the Dark: IPCC expert reviewer David Burton comments on the IPCC review process.
“Note that, until now, even the Expert Reviewers, themselves, were not permitted to see any of this material. Even while reviewing the SOD (Second Order Draft) we were not permitted to see the authors’ responses to even our own FOD (First Order Draft) comments.
“In the case of our FOD comments, we’ve had to wait nearly three years to see the authors’ responses.
“The IPCC’s “expert review” process, despite the similar name, does not resemble peer review for academic papers. The IPCC treats its own “expert reviewers” like mushrooms. The IPCC’s authors needn’t even take reviewer comments into consideration.
“Imagine an academic journal which ran its peer-review process the way that the IPCC runs their ‘expert review’ process:
- Reviewers write comments, the authors ignore them or not, as they see fit.
- Eventually (perhaps years later!) the authors write excuses for ignoring reviewers’ comments, but they don’t even show those responses to the reviewers until after the Report is published.
“That’s how the IPCC’s ‘Expert Review’ process works.
“Imagine an academic journal which conducted its peer review process like that. Would YOU trust such a journal? Would YOU publish in it?
“Of course not. Nobody sensible would.” See link under Challenging the Orthodoxy
********************
Desertification: Another UN entity is ignoring massive physical evidence. In “World ‘at a crossroads’ in management of droughts, up 29% in a generation and worsening” the UN Convention to Combat Desertification ignores decades of photographic evidence from the Landsat satellites showing the plant world is flourishing with more carbon dioxide. Instead, it claims:
“a 29 percent rise in the number and duration of droughts since 2000.
“In addition, from 1970 to 2019, weather, climate and water hazards accounted for half of world disasters and 45 percent of disaster-related deaths, mostly in developing countries.”
A quick review of an encyclopedia article on famines in the past will reveal that no matter how sad the current droughts are, they are small compared with great famines that gripped Europe, China, India, Mesoamerica, and Africa before modern agriculture using fossil fuels. See links under Defending the Orthodoxy – Bandwagon Science
********************
Fact Not Proof: The Quote of the Week states that physical evidence is needed more than mathematical proofs of existence of a concept. In countering claims that the technology exists to easily go to “net zero,” Richard Fulmer quotes energy scholar Vaclav Smil whose book How the World Really Works: The Science Behind How We Got Here and Where We’re Goingprompted an interview from The New York Times:
“’I used to live in the westernmost part of the evil empire, what’s now the Czech Republic. They forever turned me off any stupid politics because they politicized everything. So, it is now, unfortunately, in the West. Everything’s politics. No, it is not! You can be on this side or that side, but the real world works on the basis of natural law and thermodynamics and energy conversions, and the fact is if I want to smelt my steel, I need a certain amount of carbon or hydrogen to do it. The Red Book of Mao or Putin’s speeches or Donald Trump is no help in that. We need less politics to solve our problems. We need to look at the realities of life and to see how we can practically affect them….’”
See link under Challenging the Orthodoxy.
********************
SEPP’S APRIL FOOLS AWARD – THE JACKSON
SEPP is conducting its annual vote for the recipient of the coveted trophy, The Jackson, a lump of coal. Readers are asked to nominate and vote for who they think is most deserving. The entire Biden Administration won in 2021, so individuals in it are still eligible.
The voting will close on July 30. Please send your nominee and a brief reason the person is qualified for the honor to [email protected]. The awardee will be announced at the annual meeting of the Doctors for Disaster Preparedness on August 14 to 16 at the South Point Hotel and Casino in Las Vegas. Registration: https://aaps.wufoo.com/forms/qb79fo31o62uh1/; Hotel: https://be.synxis.com/?adult=1&arrive=2022-08-14&chain=6903&child=0¤cy=USD&depart=2022-08-15&group=DOC0811&hotel=11548&level=hotel&locale=en-US&rooms=1
********************
Number of the Week: 2°F every half-hour
Tuesday, May 10 was a sunny, but chilly, spring morning in the Washington suburbs of Virginia. At 7 am it was 43°F; 8 am 47°F; 9 am 51°F, 10 am 55°F, 11am 61°F. The temperature was rising 4°F every hour or 2°F every half-hour for 8 half-hours. For 43 years, since January 1979, 2.3°F (1.3°C) is the rate at which the atmosphere is warming per century. Yet, Washington has declared a climate crisis? It’s doubtful if anyone in Washington can notice a half-hour difference in temperature on a typical spring morning.
No doubt, if the rate of rise of 2.3°F continued every century for 800 years, there would be reason for concern. But there is no physical evidence that carbon dioxide is the primary cause of this increase, and that the 2.3°F will continue for 800 years. Yet, global climate models not only greatly overestimate warming of the atmosphere, but they also fail to allow for a cooling that occurs naturally. See https://www.drroyspencer.com/2022/05/uah-global-temperature-update-for-april-2022-0-26-deg-c/
Challenging the Orthodoxy — NIPCC
Climate Change Reconsidered II: Physical Science
Idso, Carter, and Singer, Lead Authors/Editors, Nongovernmental International Panel on Climate Change (NIPCC), 2013
Summary: https://www.heartland.org/_template-assets/documents/CCR/CCR-II/Summary-for-Policymakers.pdf
Climate Change Reconsidered II: Biological Impacts
Idso, Idso, Carter, and Singer, Lead Authors/Editors, Nongovernmental International Panel on Climate Change (NIPCC), 2014
http://climatechangereconsidered.org/climate-change-reconsidered-ii-biological-impacts/
Summary: https://www.heartland.org/media-library/pdfs/CCR-IIb/Summary-for-Policymakers.pdf
Climate Change Reconsidered II: Fossil Fuels
By Multiple Authors, Bezdek, Idso, Legates, and Singer eds., Nongovernmental International Panel on Climate Change, April 2019
http://store.heartland.org/shop/ccr-ii-fossil-fuels/
Download with no charge:
Why Scientists Disagree About Global Warming
The NIPCC Report on the Scientific Consensus
By Craig D. Idso, Robert M. Carter, and S. Fred Singer, Nongovernmental International Panel on Climate Change (NIPCC), Nov 23, 2015
http://climatechangereconsidered.org/
Download with no charge:
https://www.heartland.org/policy-documents/why-scientists-disagree-about-global-warming
Nature, Not Human Activity, Rules the Climate
S. Fred Singer, Editor, NIPCC, 2008
http://www.sepp.org/publications/nipcc_final.pdf
Global Sea-Level Rise: An Evaluation of the Data
By Craig D. Idso, David Legates, and S. Fred Singer, Heartland Policy Brief, May 20, 2019
The Big 5 Natural Causes of Climate Change part 3 How La Nina Warms the World
By Jim Steele, A Walk On The Natural Side, May 12, 2022
Video: https://www.youtube.com/watch?v=HXg5UCRPJJ4&t=38s
Transcript: https://perhapsallnatural.blogspot.com/2022/05/how-la-nina-warms-world-pt3-big-5.html
The Big 5 Natural Causes of Global Warming – part 1: Varying Atlantic Water Transport
By Jim Steele, A Walk On The Natural Side, April 24, 2022
Video: https://www.youtube.com/watch?v=kQbSplM6o9Y
Transcript: https://perhapsallnatural.blogspot.com/2022/04/the-big-5-natural-causes-of-global.html
Participate in the Surface Stations Project – Version 2
By Anthony Watts, WUWT, May 7, 2022
Saturation of IR Wavelengths
By Paul Homewood, Not a Lot of People Know That, May 9, 2022
Vaclav Smil: Antidote to Magical Thinking
By Richard W. Fulmer, Master Resource, May 12, 2022
“Trust” the Process: IPCC AR6 WG1 Edition
By David Burton (edited), WUWT, May 7, 2022
“Annex X: Expert Reviewers including comments not permitted for expert reviewers to see.
“In the case of our FOD [First Order Draft} comments, we’ve had to wait nearly three years to see the authors’ responses.”
Link to: Downloads: Drafts and Review Materials
By Staff, IPCC Sixth Assessment Report
Working Group 1: The Physical Science Basis, Accessed May 10, 2022
https://www.ipcc.ch/report/ar6/wg1/downloads/drafts-and-reviews/
Cold weather kills 95 times more people than heat in Mexico
By John Robson, Climate Discussion Nexus, May 11, 2022
Link to report: Mortality, temperature, and public health provision evidence from Mexico
By François Cohen and Antoine Dechezleprêtre, Grantham Research Institute on Climate Change and the Environment and Centre for Climate Change Economics and Policy, October 2019
New Study: Half The 2000-2019 Global Ocean Warming Has Been From Internal Fluxes, Not Surface Forcing
By Kenneth Richard, No Tricks Zone, May 12, 2022
Link to latest paper: Reduction in Meridional Heat Export Contributes to Recent Indian Ocean Warming
By K. McMonigal, et al., Journal of Physical Oceanography, Mar 4, 2022
https://journals.ametsoc.org/view/journals/phoc/52/3/JPO-D-21-0085.1.xml
From the abstract: “We hypothesize that the changes at the southern boundary are linked to an observed broadening of the Agulhas Current, implying that temperature and velocity data at the western boundary are crucial to constrain heat budget changes.” [Boldface added]
Trust “The Science” They Say
By Steven Hayward, Power Line, May 9, 2022
Defending the Orthodoxy
A softer U.S. climate goal? Kerry points to 1.8 degrees
By Sara Schonhardt, E & E News, May 4, 2022 [H/t No Tricks Zone]
How climate scientists keep hope alive as damage worsens
By Seth Borenstein, AP, May 8, 2022
https://apnews.com/article/climate-scientists-optimism-d1f2de75f853af68fef4f5a7e3e69071
“Hope and optimism often blossom in the experts toiling in the gloomy fields of global warming, COVID-19 and Alzheimer’s disease.”
[SEPP Comment: An interesting combination of issues all with the same solution – more government regulations.]
Defending the Orthodoxy – Bandwagon Science
Droughts increase 29 percent in a generation, only getting worse: UN
By Sharon Udasin, The Hill, May 11, 2022
Link to press release: World “at a crossroads” in management of droughts, up 29% in a generation and worsening: UN
By Staff, United Nations Convention to Combat Desertification (UNCCD), May 11, 2022
https://www.eurekalert.org/news-releases/952159
Link to report: “Drought In Numbers, 2022: Restoration for Readiness and Resilience”
By Staff, United Nations Convention to Combat Desertification (UNCCD) Accessed May 12, 2022
World has 50 percent chance of hitting 1.5-degree warming milestone in the next 5 years, UN group says
By Rachel Frazin, The Hill, May 10, 2022
“The United Nations (U.N.) weather organization also said that there’s a 93 percent chance that at least one year between 2022 and 2026 will become the warmest on record, dethroning 2016.”
To fight inflation, we must fight climate change
By David Super, The Hill, May 9, 2022
“David A. Super is a professor of law at Georgetown Law. He also served for several years as the general counsel for the Center on Budget and Policy Priorities.”
[SEPP Comment: Carbon dioxide caused warming causes inflation?]
Questioning the Orthodoxy
A “Weakening Warming Trend Of The Last 40 Years Is Apparent”, Says German Expert
Fritz Vahrenholt: The transition to green energies and the missing warming
By Kalte Sonne, Via No Tricks Zone, May 11, 2022
“Let us reassure Mr. Marotzke [of the Max Planck Institute for Meteorology]: a 2.5-degree world will not be achieved in this century because natural variations in climate dampen anthropogenic warming. Had this been adequately accounted for in climate models, we would all have been spared much public panic and flawed policy decisions.
What is that white thing in the sky?
By John Robson, Climate Discussion Nexus, May 11, 2022
[SEPP Comment: Do land use changes cause changes in cloud cover?]
Sure It’s Been Warm, But The Global Surface Temperature Rise Has Stalled…Stagnant Over The Past Decade
By Die kalte Sonne (Translated by P. Gosselin ), Via No Tricks Zone, May 7, 2022
The Global Warming Scare Is Most Certainly Overheated
By I & I Editorial Board, May 10, 2022
“Federal Scientists Say”
By Tony Heller, His Blog, May 11, 2022
https://realclimatescience.com/2022/05/federal-scientists-say/
Energy and Environmental Review: May 9, 2022
By John Droz, Jr., Master Resource, May 9, 2022
After Paris!
What Paris Agreement? Worker Shortage Impeding Global Coal Production Surge
By Eric Worrall, WUWT, May 13, 2022
Change in US Administrations
Biden administration cancels oil and gas lease sales in Alaska, Gulf of Mexico
By Zack Budryk, The Hill, May 11, 2022
[SEPP Comment: Contrary to what the article claims, the increase in domestic oil and gas prices is not due to the Russian invasion of Ukraine. North American can be energy independent.]
Biden admin cancels massive oil and gas lease sale amid record-high gas prices
Interior Department canceled a 1-million-plus acre oil lease in Alaska as Americans face painfully high prices at the pump
By Tyler O’Neil, Fox News, May 11, 2022
https://www.foxbusiness.com/politics/biden-admin-cancels-oil-gas-lease-sale-record-high-prices
The Biden Administration’s Aimless Energy Policy Is Gambling With America’s Economy
By David Holt, Real Clear Energy, May 08, 2022
https://www.realclearenergy.org/articles/2022/05/08/the_biden_administrations_aimless_energy_policy_is_gambling_with_americas_economy_831102.html
Commerce secretary: ‘I share the sense of urgency’ on solar power probe
By Zack Budryk, The Hill, May 11, 2022
[SEPP Comment: A sense of urgency to subsidize unreliable, expensive electricity generation?]
‘Bad boys’ are back: India doubles down on coal as heatwave worsens power crisis
By Nupur Anand and Sudarshan Varadhan, Reuters, May 6, 2022
https://www.reuters.com/world/india/india-looking-boost-coal-output-by-up-100-mln-tonnes-reopen-closed-mines-2022-05-06/
India going gangbusters on coal — tosses green rules, and wants to reopen 100 old mines
By Jo Nova, Her Blog, May 12, 2022
[SEPP Comment: Keeping up with China?]
Seeking a Common Ground
Pressure Data from Smartphones Could Greatly Improve Weather Prediction: Will Big Tech Help?
By Cliff Mass Weather Blog, May 12, 2022
https://cliffmass.blogspot.com/2022/05/pressure-data-from-smartphones-could.html
“For the recent, devastating Marshall Fire near Boulder, Colorado, smartphone pressures defined the low-pressure features that drove the strong winds …–something the traditional weather network missed.”
How Conservatives Can Get Climate Policy Right
Rather than fearing climate science, conservatives should embrace it. Its implications aren’t what you think.
By Colin Dueck, National Interest, May 7, 2022
https://nationalinterest.org/feature/how-conservatives-can-get-climate-policy-right-202219
Models v. Observations
The Ocean Is Still Sucking Up Carbon—Maybe More Than We Think
Recent studies looking at carbon-sequestering microbes suggest we still have a lot to learn about the ocean’s biological carbon pump.
By Nancy Averett, EOS, May 3, 2022 [H/t WUWT]
Link to papers: Adaptive carbon export response to warming in the Sargasso Sea
By Michael W. Lomas, et al, Nature Communications, Mar 8, 2022
https://www.nature.com/articles/s41467-022-28842-3
Link to second paper: Mucospheres produced by a mixotrophic protist impact ocean carbon cycling
By Michaela E. Larsson, et al. Nature Communications, Mar 14, 2022
https://www.nature.com/articles/s41467-022-28867-8
From abstract of first paper: “We present a nearly three-decade time series from the open ocean that documents a biological response to ocean warming and nutrient reductions wherein particulate carbon export is maintained, counter to expectations. Carbon export is maintained through a combination of phytoplankton community change to favor cyanobacteria with high cellular carbon-to-phosphorus ratios and enhanced shallow phosphorus recycling leading to increased nutrient use efficiency. These results suggest that surface ocean ecosystems may be more responsive and adapt more rapidly to changes in the hydrographic system than is currently envisioned in earth ecosystem models, with positive consequences for ocean carbon uptake.”
Model Issues
Timing of ocean plankton blooms to shift with global warming
Press Release, Institute for Basic Science, May 9, 2022
https://www.eurekalert.org/news-releases/952158
Link to paper: Trophic level decoupling drives future changes in phytoplankton bloom phenology
By Ryohei Yamaguchi, et al. Nature Climate Change, May 9, 2022
https://www.nature.com/articles/s41558-022-01353-1
“Our study demonstrates the power of large ensemble computer model simulations to understand how ecosystems respond to future climate change, in this case their seasonality. Having established the timing and underlying mechanisms of future plankton bloom changes, we will address further whether such changes will have a negative impact on future food security,” says Dr. Ryohei Yamaguchi from the IBS Center for Climate Physics, and lead author of the study.
[SEPP Comment: An ensemble of computer model simulations may amplify error rather than lead to greater understanding. Physical evidence is needed.]
Measurement Issues — Surface
The Parts And The Whole
By Willis Eschenbach, WUWT, May 7, 2022
What you should know about surface temperature, and another winter-like week ahead. All in my podcast.
By Cliff Mass, Weather Blog, May 13, 2022
https://cliffmass.blogspot.com/2022/05/what-you-should-know-about-surface.html
Disappearing Heat In New Jersey
By Tony Heller, His Blog, May 13, 2022
https://realclimatescience.com/2022/05/disappearing-heat-in-new-jersey/
Changing Weather
The Coldest April in the Satellite Record over the Pacific Northwest
By Cliff Mass, Weather Blog, May 8, 2022
https://cliffmass.blogspot.com/2022/05/the-coldest-april-in-satellite-record.html
[SEPP Comment: Was it caused by human CO2 emissions as the World Weather Attribution claimed last year’s record heat was?]
Coldest Christmas – 1983
By Tony Heller, His Blog, May 12, 2022
https://realclimatescience.com/2022/05/coldest-christmas-1983/
Remember snow?
By John Robson, Climate Discussion Nexus, May 11, 2022
Plummeting May 12 Temperatures In The US
By Tony Heller, His Blog, May 13, 2022
https://realclimatescience.com/2022/05/plummeting-may-12-temperatures-in-the-us/
Tornado Outbreak Of May 13, 1908
By Tony Heller, His Blog, May 13, 2022
https://realclimatescience.com/2022/05/tornado-outbreak-of-may-13-1908/
Changing Climate
Extreme Weather during the Maunder Minimum
By Paul Homewood, Not a Lot of People Know That, May 8, 2022
Changing Seas
Global Sea Surface Temperature Records Suggest Only Modest Warming In The 20th And 21st Centuries
By Kenneth Richard, No Tricks Zone, May 9, 2022
CDN by the Sea, Adelaide Australia
By John Robson, Climate Discussion Nexus, May 11, 2022
International Satellite to Track Impacts of Small Ocean Currents
By Charles Rotter, WUWT, May 11, 2022
Changing Cryosphere – Land / Sea Ice
Wandering polar bears are the new starving bears falsely blamed on climate change: Déjà vu
By Susan Crockford, Polar Bear Science, May 12, 2022
Acidic Waters
We are all going to die, part 44
By John Robson, Climate Discussion Nexus, May 11, 2022
Agriculture Issues & Fear of Famine
How climate change kills crops
By John Robson, Climate Discussion Nexus, May 11, 2022
Link to article: Heather Exner-Pirot: The green transition has created a global food crisis that will only get worse
We are getting all of the pain of soaring costs and none of the climate benefit. It is a policy disaster of the worst kind
By Heather Exner-Pirot,National Post (Canada), Apr 12, 2022
https://nationalpost.com/opinion/heather-exner-pirot-the-green-transition-has-created-a-global-food-crisis-that-will-only-get-worse
“Heather Exner-Pirot is a senior policy analyst at the Macdonald-Laurier Institute.”
“These are examples of how the global energy crisis impacts just about everything humans need. According to Bloomberg, energy costs will surpass 13 per cent of global GDP this year — the highest proportion in modern times. By comparison, it was less than four per cent of global GDP in 2020, and 6.5 per cent in 2021.
“That nine per cent of global GDP, which represents about $8.5 trillion, could have been spent on education, health, infrastructure, housing or other important measures. Instead, it has been siphoned off into spiraling energy costs created not from a lack of energy resources, but from climate policies that intentionally reduced their supply by limiting investment and rejecting new exploration, infrastructure and production.”
Lowering Standards
BBC climate editor made false claims on global warming–Mail
By Paul Homewood, Not a Lot of People Know That, May 10, 2022
New Statesman Condones BBC Fake News
By Paul Homewood, Not a Lot of People Know That, May 13, 2022
Communicating Better to the Public – Exaggerate, or be Vague?
Addled eggs
By John Robson, Climate Discussion Nexus, May 11, 2022
“And it is a very interesting illustration of how to make a logical omelette. Because when animals are observed not to change their behaviour it’s bad because it shows they can’t adapt quickly enough to global warming, but when they do change their behaviour and adapt, it’s bad because, well, because they had to change their behaviour. And if birds are laying earlier it’s also bad, because having a longer warm season for the fledglings to hatch, grow and take wing is obviously bad.”
Study finds cleaner air leads to more Atlantic hurricanes
By Seth Borenstein, Phys.org, May 11, 2022 [H/t Bernie Kepshire}
https://phys.org/news/2022-05-cleaner-air-atlantic-hurricanes.html
Link to paper: Substantial global influence of anthropogenic aerosols on tropical cyclones over the past 40 years
By Hiroyuki Murakam, AAAS Science Advances, May 11, 2022
https://www.science.org/doi/10.1126/sciadv.abn9493
[SEPP Comment: Weak correlations at best!]
Communicating Better to the Public – Make things up.
Claim: World’s Ocean Is Losing Its Memory Under Global Warming
Press Release, University of Hawaii at Manoa, Via WUWT, May 8, 2022
Link to paper: Global decline in ocean memory over the 21st century
By Hui Shi, et al. AAAS Science Advances, May 6, 2022
https://www.science.org/doi/10.1126/sciadv.abm3468
From the abstract:” Ocean memory, the persistence of ocean conditions, is a major source of predictability in the climate system beyond weather time scales.”
“Reduced ocean memory results in shorter lead times of skillful persistence-based predictions of sea surface thermal conditions, which may present previously unknown challenges for predicting climate extremes and managing marine biological resources under climate change.”
How The German ‘Zeit’ And WMO Misled The Public In Reporting On Global Natural Disaster Trends
By P Gosselin, No Tricks Zone, May 6, 2022
“WMO, Zeit caught cooking doomsday statistics on natural disasters.”
Time Magazine: 200 Feet Of Sea Level Rise
By Tony Heller, His Blog, May 11, 2022
https://realclimatescience.com/2022/05/time-magazine-200-feet-of-sea-level-rise/
Communicating Better to the Public – Use Propaganda
Another Day–Another Warming Scare!
By Paul Homewood, Not a Lot of People Know That, May 11, 2022
“The reality, unlike the BBC’s vision of apocalypse, is that any changes to the Earth’s climate are tiny and would be unnoticeable if the media was not constantly banging on about it.”
In sediments below Antarctic ice, scientists discover a giant groundwater system
Previously unmapped reservoirs could speed glaciers, release carbon
Press Release, Columbia Climate School, May 5, 2022 [H/t WUWT]
https://www.eurekalert.org/news-releases/951398
A dynamic saline groundwater system mapped beneath an Antarctic ice stream
By Chiloe Gustafson, AAAS Science, May 5, 2022 [H/t WSJ]
https://www.science.org/doi/10.1126/science.abm3301
From abstract: “Our results provide new constraints for subglacial water systems that affect ice streaming and subglacial biogeochemical processes.”
[SEPP Comment: The article was noted in last week’s TWTW without the alarmist twists given by Columbia University: “In response to the climate crisis, Columbia University has created the Climate School to develop innovative education, support groundbreaking research and foster essential solutions, from the community to the planetary scale. https://climate.columbia.edu/
“The Earth Institute, Columbia University mobilizes the sciences, education and public policy to achieve a sustainable earth. www.earth.columbia.edu.’”
Rowlatt Labelled As Campaigner By BBC Colleagues
By Paul Homewood, Not a Lot of People Know That, May 13, 2022
“Too left wing by BBC standards! Crikey!”
Expanding the Orthodoxy
Soros, Club of Rome Pushing Global Equity
By Paul Homewood, Not a Lot of People Know That, May 9, 2022
[SEPP Comment: If you believe in the computer driven predictions of the Club of Rome, we already ran out of oil and gas, so burning these fuels cannot cause future warming!]
SEC extends deadline for public to comment on climate risk proposal
By Rachel Frazin, The Hill, May 9, 2022
Portal to submit comments: https://www.sec.gov/regulatory-actions/how-to-submit-comments
“In a Monday press release, the SEC said that people will now have until June 17 to comment on the proposal,…”
Questioning European Green
Rishi Sunak’s net zero u-turn
By Rupert Darwall, The Spectator (UK), May 12, 2022
https://www.spectator.co.uk/article/rishi-sunak-s-cop-speech-is-coming-back-to-haunt-him
“High oil and gas prices should induce a supply-side response. In the past, they led to increased investment, which in turn led to increased output and falling prices. This time is different. Institutional investors managing over $130 trillion of assets have signed on the dotted line of the Glasgow Financial Alliance for Net Zero: ‘an historic wall of capital for the net zero transition,’ Sunak told the Glasgow climate conference.”
“Governments, not financiers, are held accountable by voters for the performance of their economies. Governments, not financiers, are responsible for national security.”
“The government reckons the shadow price of carbon to meet net zero is £248 per tonne of carbon dioxide in 2020 money. Imposing a £248 per tonne carbon tax would be swift and sure way of committing electoral suicide.”
Questioning Green Elsewhere
How the ESG Movement is Shooting Itself in the Foot
By Bette Grande, American Thinker, May 12, 2022
https://www.americanthinker.com/articles/2022/05/how_the_esg_movement_is_shooting_itself_in_the_foot.html
Green Jobs
US Offshore Wind Jobs are Highly Exaggerated
By David T. Stevenson, Caesar Rodney Institute, May 13, 2022
https://www.caesarrodney.org/CRI-news/US-Offshore-Wind-Jobs-are-Highly-Exaggerated.htm
Funding Issues
We deniers may have all the money, but…
By John Robson, Climate Discussion Nexus, May 11, 2022
“At some point they’re going to have to admit that practical methods, far from being some dirty denier trick, are a vital component of public policy. And that, as Thomas Sowell famously observed, ‘reality is tricky”’.
The Political Games Continue
U.S. Senate committee passes antitrust bill pressuring OPEC
By Timothy Gardner, Reuters, May 5, 2022
https://www.reuters.com/legal/litigation/us-senate-committee-consider-bill-pressuring-opec-oil-group-2022-05-05/
UAE, Saudi energy ministers hit back at ‘NOPEC’ bill, say it could send oil prices surging
By Karen Gilchrist, CNBC, May 10, 2022
https://www.cnbc.com/2022/05/10/uae-saudi-arabia-energy-ministers-hit-back-at-nopec-bill.html
U.S. Gasoline Prices Hit All-Time High
By Irina Slav, Oil Price.com, May 10, 2022
https://oilprice.com/Energy/Energy-General/US-Gasoline-Prices-Hit-All-Time-High.html
“180-million-barrel SPR release failed to materially lower prices at the pump.”
Cap-and-Trade and Carbon Taxes
Carbon Border Adjustment Tax
By Jordan McGillis, Institute for Energy Research, May 11, 2022
Energy Issues – Non-US
Europe May Face LNG Crisis This Winter
By Staff, Rystad Energy Oil Price.com, May 09, 2022
https://oilprice.com/Energy/Energy-General/Europe-May-Face-LNG-Crisis-This-Winter.html
Fallacies of Supplying American LNG and Electric Heat Pumps to Europe to Fight Putin and Global Warming
By Mark Krebs, Real Clear Energy May 09, 2022
https://www.realclearenergy.org/articles/2022/05/09/fallacies_of_supplying_american_lng_and_electric_heat_pumps_to_europe_to_fight_putin_and_global_warming_831391.html
Energy Issues – Australia
Mayhem on the Australian Grid continues — Record prices, factory shutdowns, emergency warnings
By Jo Nova, Her Blog, May 10, 2022
Fever-priced in South Australia today: Ten hours forecast above $10,000 a megawatt…
By Jo Nova, Her Blog, May 12, 2022
Link to AEMO national electricity market data
https://aemo.com.au/energy-systems/electricity/national-electricity-market-nem/data-nem/data-dashboard-nem
Energy Issues — US
Regulation Will Not Solve Our Energy Problems
By Dan Romito, Real Clear Energy, May 12, 2022
https://www.realclearenergy.org/articles/2022/05/12/regulation_will_not_solve_our_energy_problems_832082.html
US Faces Electricity Shortages Heading Into Summer, as Grid Operators Warn of Limits of Green Energy
Evidence shows America’s power grid is increasingly unreliable and struggling to keep up with energy demand.
By Jon Miltimore, FEE, May 10, 2022
https://fee.org/articles/us-faces-electricity-shortages-heading-into-summer-as-grid-operators-warn-of-limits-of-green-energy/
WSJ: Power Grid Operators Warn Renewable Energy Could Cause Blackouts
By Eric Worrall, WUWT, May 9, 2022
Record High Diesel Prices Will Ripple Across The Economy
By Tsvetana Paraskova, Oil Price.com May 10, 2022
https://oilprice.com/Energy/Energy-General/Record-High-Diesel-Prices-Will-Ripple-Across-The-Economy.html
Power Grid Operators Warn Of Potential Electricity Shortages Amid Transition To Clean Energy
By Tyler Durden, Zero Hedge, May 9, 2022 [H/t Bernie Kepshire]
https://www.zerohedge.com/commodities/power-grid-operators-warn-potential-electricity-shortages-amid-transition-clean-energy
A Summer of Blackouts?
Thanks to hasty closures of fossil-fuel and nuclear plants, coupled with shortfalls in renewable-energy production, Americans will face increasing power outages.
By Steven Malanga, City Journal, May 11, 2022
https://www.city-journal.org/energy-policy-failures-may-lead-to-summer-blackouts
“A few years ago, the United States celebrated a kind of energy independence when it became a net energy exporter for the first time since 1952, thanks in part to the fracking boom. But closures of fossil-fuel and nuclear power plants, coupled with renewables’ inability to make up the resulting energy deficit, have left some areas of the country with little margin for error amid a world energy crisis worsened by the Ukraine war. Though the U.S. is the world’s most prosperous and technologically advanced country—it sits on nearly 275 billion barrels of untapped oil alone—millions of Americans may endure a summer of blackouts because of avoidable policy failures.”
Washington’s Control of Energy
“Price Gouging” Again
By Robert Bradley, Jr. Institute for Energy Research, May 12, 2022
The Clean Energy Minerals Reform Act Is the Wrong Solution for American Mining
By Pete Stauber, Real Clear Energy, May 11, 2022
https://www.realclearenergy.org/articles/2022/05/11/the_clean_energy_minerals_reform_act_is_the_wrong_solution_for_american_mining_831823.html
Oil and Natural Gas – the Future or the Past?
Saudi Energy Minister: Insufficient Investment To Blame For High Fuel Prices
By Tsvetana Paraskova, Oil Price.com, May 09, 2022
https://oilprice.com/Energy/Energy-General/Saudi-Energy-Minister-Insufficient-Investment-To-Blame-For-High-Fuel-Prices.html
Return of King Coal?
Does America Have a Secret Energy Source? Yes, It’s Coal
By Dan Ervin, Real Clear Energy, May 11, 2022
https://www.realclearenergy.org/articles/2022/05/11/does_america_have_a_secret_energy_source_yes_its_coal_831781.html
[SEPP Comment: As Washington continues to shut down oil and gas, coal is a far more reliable alternative for electricity generation than solar and wind.]
Alternative, Green (“Clean”) Solar and Wind
Bird Migration Day: Dim the Lights … or Turn Off the Turbines?
By Robert Bradley Jr., Master Resource, May 13, 2022
Alternative, Green (“Clean”) Vehicles
EVs on Fire! Electric Utopia Takes a Deadly U-Turn
By Vijay Jayaraj, CO2 Coalition, May 8, 2022
RAC Finally Realise That Some EV Owners Will Be Worse Off!!
By Paul Homewood, Not a Lot of People Know That, May 12, 2022
“Homeowners without a driveway or garage can expect EV charging costs to be almost £1000 a year higher.”
California Dreaming
California officials warn of likely summer power shortages, blackouts
By Sara Donchey, CBS Bay Area, May 7, 2022
https://www.cbsnews.com/sanfrancisco/news/california-officials-warn-summer-power-shortages-blackouts/
“’Can we expect blackouts? No. But again, we don’t know what to expect with climate change that’s hitting us so were looking at this from a very pragmatic where we’re really analyzing what the worst case could be and we’re trying to make sure we do everything we can to be prepared for that,’ [California Public Utilities Commission president Alice] Reynolds said.”
Claim: California can Hit 85% Renewable Energy by 2030
By Eric Worrall, WUWT, May 12, 2022
“But anyone with an ounce of engineering talent can see where California’s ruinous policies could lead, the human tragedy in the making, how close California and other green states are to losing all the security and comfort their parents and grandparents worked their butts off to provide.”
California unveils ambitious set of offshore wind targets
By Sharon Udasin, The Hill, May 9, 2022
Link to draft report: Offshore Wind Energy Development off the California Coast Maximum Feasible Capacity and Megawatt Planning Goals for 2030 and 2045
By Staff, California Energy Commission, May 2022
file:///C:/Users/Owner/Downloads/TN242970_20220506T171314_AB525%20Offshore%20Wind%20Report.pdf
“Staff members of the California Energy Commission (CEC) prepared this report. As such, it does not necessarily represent the views of the CEC, its employees, or the State of California.”
[SEPP Comment: Another report representing nothing but will be used to batter those who object!]
Other News that May Be of Interest
Do 100 million lives Matter? De Santis announces a Victims of Communism Day
By Jo Nova, Her Blog, May 13, 2022
BELOW THE BOTTOM LINE
Avoid using gas as ‘transition’ fuel in move to clean energy, study urges
Analysis says countries can save money by switching from coal straight to renewable energies
By Fiona Harvey, the Guardian, May 9, 2022 [H/t Bernie Kepshire]
https://www.theguardian.com/environment/2022/may/10/avoid-using-gas-transition-fuel-move-clean-energy-study-urges
[SEPP Comment: Save money, abandon manufacturing! Unable to link to report.]
“Germany Poised to Become LNG Powerhouse”???
By David Middleton, WUWT, May 13, 2022
Stop Using So Many Towels, Urges Prince Harry!
By Paul Homewood, Not a Lot of People Know That, May 11, 2022
“You really could not make it up!”
The Guardian wins Voodoo Bingo — little Ice Age caused by Volcanoes, White men and CO2
By Jo Nova, Her Blog, May 11, 2022
ARTICLES
Does Biden Want Higher Gas Prices?
The Administration cancels offshore oil lease sales, despite surging global prices.
By The Editorial Board, WSJ, May 13, 2022
https://www.wsj.com/articles/does-joe-biden-want-higher-gas-prices-oil-leases-offshore-11652468751?mod=hp_opin_pos_3#cxrecs_s
TWTW Summary: The editorial begins:
“Another week, another example of the Biden Administration’s energy incoherence. On Tuesday the President blamed record gasoline prices on Vladimir Putin. The next day the Interior Department announced the cancellation of three offshore oil and gas lease sales, setting up the possibility that there won’t be any during his Presidency.
“It’s been nearly a year since a federal judge blocked President Biden’s oil and gas leasing ban on federal lands. Yet the Administration has interpreted the injunction as merely hortatory. After dragging its feet, Interior last November held an offshore sale in the Gulf of Mexico under a five-year leasing plan finalized by the Obama Administration.
“A liberal federal judge vacated those sales in January, on the legal stretch that the government didn’t consider the greenhouse-gas emissions of the oil that would be produced by the leases and consumed abroad. The Administration chose not to appeal, and it now blames the judge for its decision to cancel three auctions that were scheduled this year under the Obama five-year plan.
“Interior also cites a lack of interest from industry, but the November sale drew strong demand. Two lease sales would have been in the Gulf of Mexico and the other in Alaska’s Cook Inlet. Alaskan producers filed comments with Interior supporting the sale. It seems Interior simply didn’t care.
“The Gulf of Mexico has among the lowest break-even production costs (about $30 per barrel) and greenhouse-gas emissions of any oil field in the world. But offshore production, unlike shale drilling, requires substantial up-front investment and thus regulatory certainty.
“Liberals say offshore sales won’t immediately increase oil production or reduce gasoline prices. But the cancellation creates more uncertainty and sends another signal that the Administration wants to keep U.S. oil and gas investment in the ground.
“Russian production may be headed for long-term decline owing to sanctions and the departure of Western producers. This makes it more likely that oil prices will stay high even if there is a cease-fire in Ukraine—that is, unless U.S. investment and production ramp up. The Saudis have repeatedly rebuffed President Biden’s pleas to pump more.
“His Administration is nonetheless doing everything it can to limit U.S. investment and production. The Obama five-year offshore plan expires in June. Yet the Administration’s budget indicates it doesn’t plan to hold another sale in the Gulf until at least fiscal year 2024.”
After discussing a change by the investment company BlackRock the editorial concludes:
“Now would be the time for Mr. Biden to pivot as well, but he refuses. The only explanation is that he and his advisers are unwilling to challenge the climate dogmatists in his party. The gentry left trumps the middle class. As a result Americans could be paying higher energy prices long after he leaves the White House.”