In addition to my public outreach activities, such as this blog, I have a “day job” as a professor of atmospheric sciences, where I not only teach a collection of classes but do research and publish.
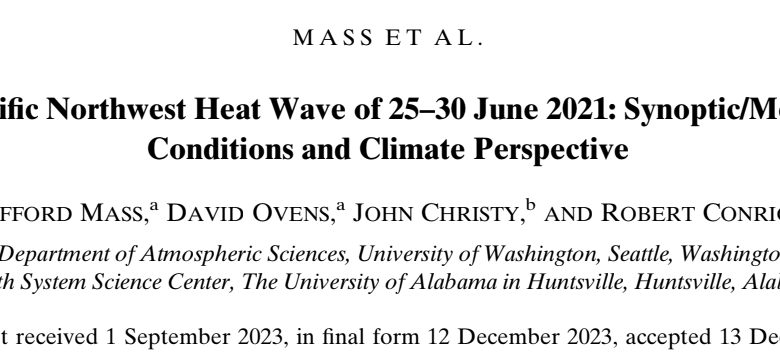
During the past few years, I have been actively studying the 2021 Northwest heatwave with my students and staff (and outside researchers), and have published two papers in the peer-reviewed, refereed literature on this event (see below, including links to read them yourselves).


The conclusions of this peer-reviewed research are somewhat different from some of the extreme claims by some in the media and by some activist groups, and I want to show you some of the evidence.
The bottom line: natural variability was the key cause of the heat wave, with human-caused global warming playing only a small role.
Let me show you some of the most interesting graphics from the paper.
One strong finding was that the June 2023 extreme temperatures were unique and crazy extreme. The heat was NOT the result of slow planetary warming that one would expect from increasing CO2 for human emissions.
The 2024 paper demonstrates this fact in several ways. Below is a plot of the annual warmest surface temperatures for the entire record at Quillayute, on the Washington Coast, and Lytton, BC, where Canada’s all-time high temperature was observed.

Note that high temperatures at both stations were absolutely unique: not only the highest in record but radically higher than previous high temperatures. I have also placed a trend line on there as well.
There is a small upward trend on average (about 1°C over the past 40 years)…and that could be due to human forcing. But this trend hardly explains the huge warm anomaly in 2021.
Another way to see how anomalous June 2021 was is to plot the frequency of annual high temperatures over the entire record (see below for Portland, Quillayute, and Lytton, BC). The red arrow shows the value in 2021.
Amazing. The 2021 high temperatures are from a different world. Nothing is even close.

In my paper, we tried a different, independent approach to determine whether that 2021 heatwave was unprecedented. My co-author, John Christy of the University of Alabama, a world-leader in the use of satellite data to measure earth’s temperature, looked at lower-atmosphere temperatures from 1979 to today, all based on sophisticated satellite measurements.
The map below shows the difference from normal of the temperatures for a five-day period encompassing the 2021 heatwave.
Wow. A HUGE warm temperature anomaly over our region. Nothing like it anywhere on the planet.

Then he found something startling. This extreme warmth over our region was the warmest s anomaly during mid-summer anywhere in the northern hemisphere for the ENTIRE observational record.
The 2024 paper also determined the ingredients that produced the insane 2021 heatwave.
We showed there there was the strongest ridge of high pressure aloft of the entire meteorological record (see figure below at 500 hPa…about 18,000 ft) over our region. We also note that there is no scientific evidence that global warming produces stronger ridges ( I have published papers on this issue)

A recently published paper (see below) traces this extreme high pressure to a long train of atmospheric waves originating in the western Pacific. These waves were initiated by a very unusual configuration of sea surface temperature and moisture.

At low levels, the sinking and warming of the ridge aloft were enhanced by offshore-directed easterly flow forced by an approaching low-level trough (see below for around 5000 ft, 850 hPa).

In short, a lot of random pieces came together to create an unprecedented heat wave, with background global warming only contributing about 10% of the extreme heat.
What about dry conditions before the heatwave? Did dry soils play a major role?
We completed a paper exploring this issue (Conrick and Mass 2023). We ran two simulations of the event: one with actual (dry) soil moisture values and the other with normal/moister (or climatological values). The result is shown below. The modestly drier than normal conditions caused about 1.5C warming in eastern Washington and very little in western Washington.
In short, previous dry conditions had only a small impact.

Finally, our paper described the near-perfect forecasts of this record event, even 3-5 days before. Such forecast skill can greatly reduce the impacts and death tolls from extreme heatwaves.

Forecast temperature at Seattle from the NOAA GFS ensemble model, the red dot
shows the observed highs.
In summary, the June 2021 heatwave was one of the most extreme such events in the observational record. Natural processes dominated, with multiple factors coming together in an optimal way.