When I write this blog, I generally follow a ” Five-Day Rule of Weather Prediction” and so should you.
Here is the rule:
Predictions of severe or exciting weather for more than five days out should be considered with caution. Be VERY careful of hyping forecasts for longer periods. Be aware of the uncertainty of big events predicted at longer lead times.
I have noticed that some media and popular local amateur sites (on YouTube, X, and other media) regularly break the five-day rule, often hyping events that often never occur.
Crying wolf like that is not a good thing.

Several local outlets have gone for a major snow/cold event over the Washington lowlands this week (Wednesday through Friday), which is becoming increasingly doubtful.
Why a five-day rule?
I know… picking a certain period (five days) certainly has an arbitrary aspect to it, but there is some good data to support such a period.
Below are the statistics of skill over time (for 2022) of the National Weather Service’s main model (GFS), as well as the ensemble average of collections of many forecasts (GEFS and NAEFS) over the Northern Hemisphere. A value of 1 is a perfect forecast.
The skill during the first three days of the GFS model (blue color) is excellent (0.95 for more). Forecast skill declines for days 4-5 but is still high. But skill really starts to slide between days 6-8.

Sometimes forecast skill declines more rapidly than five days.
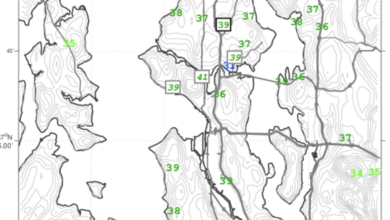
Consider a very powerful storm that will move across southern BC on Tuesday.
The 72-hour forecast (and one before that) has a strong low crossing the northern tip of Vancouver Island at 4 AM Friday.

The 120 h (5-day) forecast for the same time had TWO weak lows.

And the 180-hour forecast (7.5 days) has NO low centers within the domain.

Major deterioration of forecast skill over time.
The long-period forecast skill for snow events is even lower than for low centers or other single features because getting snow over western Washington requires getting many unusual features correct at exactly the same time.
So what do we do?
Sometimes the forecasts go bad at 3-4 days and sometimes they are good for 7-10 days.
How can meteorologists tell what situation we are dealing with?
Let me show you an example….and also reveal some meteorological “dirty laundry,:
Below are temperatures from the NOAA GFS ensemble (called GEFS) for surface air temperatures at SeaTac Airport out 8 days. The forecasts all started this morning at 4 AM. Each gray line is a different forecast. The blue line is the single high-resolution GFS forecast and the black line is the average of the ensemble of forecasts.
For the first few days, all the forecasts are on the same page. You can have confidence in those short-term predictions.
Then the forecasts start to diverge a bit, but only differ by a few degrees.

But then starting around January 12th the forecasts radically vary, with temperatures from near 0F to 45F.
Obviously, confidence in the forecast at this time has gone into the dumps. And the cooler temperatures are crazy and unphysical, representing a serious flaw in the National Weather Service’s main model (the dirty laundry).
Enjoy the windstorm….and the serious snow in the mountains.