https://doi.org/10.1016/j.wace.2021.100406
Under a Creative Commons license
Jhan-CarloEspinozaaJosé AntonioMarengobJochenSchongartcJuan CarlosJimenezd
aInstitut des Géosciences de l’Environnement, Université Grenoble Alpes, IRD, CNRS, 70 Rue de la Physique, Bat. OSUG- B. Domaine Universitaire, 38400, Saint Martin d’Hères, France
bNational Centre for Monitoring and Early Warning of Natural Disasters CEMADEN, Estrada Doutor Altino Bondesan, 500 – Distrito de Eugênio de Melo, São José dos Campos, SP, CEP:12.247-060, Brazil
cNational Institute for Amazon Research (INPA), Department of Environmental Dynamics, 2936, Av. André Araújo, Manaus, Amazonas, 69067375, Brazil
dGlobal Change Unit (GCU) of the Image Processing Laboratory (IPL), Universitat de València Estudi General (UVEG), C/ Catedrático José Beltrán 2, 46980, Paterna, Valencia, Spain
Received 5 August 2021, Revised 30 September 2021, Accepted 11 December 2021, Available online 14 December 2021.
Abstract
In June 2021 a new extreme flood was reported in the Amazon Basin, the largest hydrological system on Earth. During this event water level was above 29 m (the emergency threshold) for 91 days at Manaus station (Brazil), surpassing even the previous historical flood of 2012. Since the late 1990s, 9 extreme floods occurred, while only 8 events were reported from 1903 to 1998. Here we report that the 2021 flood is associated with an intensification of the atmospheric upward motion in the northern Amazonia (5°S-5°N), which is related to an intensification of the Walker circulations. This atmospheric feature is associated with an enhanced of deep convective clouds and intense rainfall over the northern Amazonia that produce positive anomalies of terrestrial water storage over northern Amazonia in the 2021 austral summer. The intensification of Walker circulation is associated with La Niña conditions that characterize the major floods observed in Amazonia during the 21st century (2009, 2012 and 2021). However, during the 2021 an intensification of the continental Hadley circulation is also observed. This feature produces simultaneous dry conditions over southern and southeastern Amazonia, where negative rainfall anomalies, low frequency of deep convective clouds and negative anomalies of terrestrial water storage are observed.
1. Introduction
The Amazon River has the highest average discharge in the world with approximately 200,000 m³/s (Meade et al., 1991, Callède et al., 2004; Latrubesse 2008). Four of the ten largest rivers in the world, considering their discharge, occur in the Amazon Basin (Solimões-Amazonas, Madeira, Negro and Japurá) (Latrubesse 2015). Due to the absent of a road network in the past, most cities, rural settlements and indigenous villages in the Central Amazon region have been established along the large flood-pulsing rivers. The associated floodplains have been settled and used for centuries by indigenous and traditional populations performing activities for subsistence and commerce such as agriculture, livestock production, fishery and forestry which are intrinsically related to the annual hydrological cycle (Junk et al., 2000). During the last three decades the hydrological regime in the largest watershed on Earth was characterized by a higher frequency of extreme floods and droughts (Fig. 1) (Marengo and Espinoza., 2016; Marengo et al., 2018). This intensification has severe impacts on the urban and rural riverine population and associated socioeconomic sectors. Flooding also alters sediment transport – an important process for downstream ecosystems, fisheries and farms – and carbon storage in plants, soils and wetlands (Abril et al., 2014, Armijos et al., 2020). Therefore, extreme floods can cause extensive agricultural and infrastructure damage.

At the Port of Manaus (Central Amazonia), where daily water level measurements exist since September 1902, when the water level reaches the threshold of 29.0 m (threshold value determined by the Brazilian Geological Survey – CPRM), emergency situation is declared due to the severe impacts on public health, loss of infrastructure, properties and impacts on several socioeconomic sectors (Maciel et al., 2020). At this hydrological station major flood events (water level >29 m) occurred during the first seven decades of the instrumental record with a return period of about 20 years but reduced to about four years in the recent decades (Barichivich et al., 2018).
Wet season in the southern part of the Amazon region is detected during austral summer (December–February) while in central Amazonia is concentrated in March–May and in the Amazon region north of the equator is concentrated in June–August. However, in the northwestern Amazonia abundant rainfall (>3000 mm/year) is observed most of the year, with higher values during austral summer and autumn (Figueroa and Nobre 1990; Espinoza et al., 2009a). The intensification of the hydrological regime in Amazonia is mainly associated with a contrasted evolution of rainfall over the basin (Wang et al., 2018; Espinoza et al., 2019a; Funatsu et al., 2021). An increase in rainfall amount is observed over northern Amazonia (north of 5°S) during the austral summer and autumn since the end of the 1990s. Rainfall in northern Amazonia has significantly increased by 180–600 mm in the December–May season during the satellite era (1979–2015) (Wang et al., 2018). Consequently, a discharge increase is also detected over the main northern and northwestern tributaries of the Amazon River (Espinoza et al., 2009b; Heerspink et al., 2020). In contrast, a rainfall diminution is observed over southern Amazonia during the austral winter and spring, associated with the delay of the South American Monsoon System (SAMS) onset, resulting in a lengthening of the dry season (Marengo et al., 2011, 2018; Fu et al., 2013; Arias et al., 2015; Espinoza et al., 2021). Average and minimum river discharge during the low water season at Porto Velho station in the upper Madeira River (Southern Amazonia) shows a significant diminution of around 20% since the 1970s (Espinoza et al., 2009b; Lopes et al., 2016; Molina-Carpio et al., 2017).
These changes in the Amazonian rainfall patterns have been related to the intensification of the Hadley and Walker circulations (e.g. Yoon and Zeng, 2010; Arias et al., 2015; Espinoza et al., 2016, 2019a; Barichivich et al., 2018; Agudelo et al., 2019). Indeed, Schwendike et al. (2015) estimated a strengthened of the Hadley circulation by 1–5% in the period of 1979–2009. Substantial warming of the tropical Atlantic and simultaneously cooling of the tropical Pacific since the 1990s plays a central role in rainfall trends (Arias et al., 2015; Espinoza et al., 2016, 2019a; Barichivich et al., 2018; Wang et al., 2018). The warming of the tropical Atlantic increased atmospheric water vapor, which is imported by trade winds into the northern Amazon Basin and this transport is feed by moisture recycling from the Amazon forests (Gloor et al., 2015; Marengo et al., 2020). Thus, an increase in atmospheric upward motion is observed since the late 1990s related to the upward branch of the Walker and Handley circulations (Gloor et al., 2013; Arias et al., 2015; Espinoza et al., 2019a). In contrast, during the last decades an increased atmospheric subsidence is observed in southern Amazonia during the dry-to-wet transition season, associated with the descending branch of the continental Hadley circulation (Arias et al., 2015; Agudelo et al., 2019; Espinoza et al., 2019a, 2021).
In the northern and northwestern Amazon, the warming of the tropical Atlantic during the last three decades explains more than 50% of the increase in precipitation (Wang et al., 2018). Studies have associated the increase in the frequency and magnitude of floods with the increase in SSTs in the tropical Atlantic and simultaneously the cooling in the Central equatorial Pacific (La Niña events) in the period 1990–2015, associated to low-frequency oscillations such as the Multidecadal Atlantic Oscillation (AMO) and Interdecadal Pacific Oscillation (IPO), which have been in opposite phases during this period (warm phase of the AMO and cold phase of the IPO) (Barichivich et al., 2018). In addition to these long-term changes in the Amazonian hydrological regime, interannual rainfall variability in the Amazon Basin has been usually related to El Niño-Southern Oscillation (ENSO), with several extreme floods (droughts) related to La Niña (El Niño) events. However, some droughts as in 1979–81 and 2005 were not related to strong El Niño (Marengo and Espinoza, 2016).
In addition to the Atlantic and Pacific, the Indian Ocean also indirectly contributes to the intensification of the hydrological regime in the Amazon Basin. During the last decades the displacement of the Southern Hemisphere Westerlies towards Antarctica, resulted into an increasing leakage of warm water from the Indian Ocean around the tip of South Africa into the Atlantic Ocean (Agulhas Leakage) (Biastoch et al., 2009). These imported warm waters reach the tropical Atlantic with a longer time lag by the Atlantic meridional overturning circulation (Beal et al., 2011; Barichivich et al., 2018).
Therefore, while extreme floods are more frequents during the last decades, La Niña events can enhance the magnitude of the wet season in northern Amazonia (e.g., in 1999; 2009; 2012), but also extreme floods have been reported during neutral ENSO years (e.g. in 2014 and 2017) (Espinoza et al., 2014; Marengo and Espinoza., 2016; Towner et al., 2021) or even during weak El Niño years such as in 2019. In this context, evidencing the climatological patterns and understanding the mechanism beyond this extreme hydroclimatic event in comparison to other previous severe floods is of high relevance for the development of seasonal forecast systems and future scenarios. This study aims to analyze the climatological characteristics of the excessive rainfall that triggered the 2021 flood in Amazonia and compare its hydro-climatic features with previous extreme floods observed in the 21st century in the context of intensification of Amazonian floods.
2. Hydroclimatic data
2.1. Water level record
We obtained daily water level records for the Port of Manaus, publicly available since September 1902 on the Hidroweb platform of the National Water Resources Information System (SNIRH) operated by the Brazilian National Water Agency (ANA) and the Geological Survey of Brazil (CPRM) and daily actualized on the platform https://www.portodemanaus.com.br/?pagina=nivel-do-rio-negro-hoje. For each year we obtained the maximum (flood) and minimum (drought) water level, which generally occur in June and end of October/beginning of November (Schöngart and Junk, 2007). Based on this, the annual amplitude as the difference between the maximum and minimum water level of the previous year was calculated. At the Manaus site, extreme hydrological floods (droughts) were defined according to the established threshold of 29.0 m (15.8 m) corresponding to the emergency situation (Barichivich et al., 2018; Maciel et al., 2020). For severe floods we calculated the duration of the emergency situation by the number of consecutive days above the critical threshold.
2.2. Terrestrial water storage from the GRACE and GRACE-FO missions
In this study the equivalent water thickness is used as proxy of the terrestrial water storage (TWS) in the Amazon Basin. This information is estimated by the GRACE and GRACE-FO missions that consists of twin satellites that measure changes in the Earth’s gravity field due to displacement of water, air or land masses (Tapley et al., 2004; Landerer et al., 2020). Previous studies have shown the capacity of GRACE and GRACE-FO to depict water storage variations over the hydrological basins at large spatial scales (Tapley et al., 2004; Ramillien et al., 2008; Boergens et al., 2020) as well as for validation purposes into hydrological models (Getirana et al., 2011; Paiva et al., 2013; Siqueira et al., 2018). In this study, we use the RL06 Level-3 version of monthly time-variable gravity data with spherical harmonic coefficients up to one degree, which has a spatial resolution of ∼1°x ∼1° with a monthly time step. We use the products of equivalent water thickness developed by The Jet Propulsion Laboratory (JPL), the University of Texas Center for Space Research (CSR) and the GeoForschungsZentrum (GFZ) Potsdam. All of these products are based on the GRACE and GRACE-FO gravimeter raw data. The RL06 data used in this work are 163-month (GRACE, April 2002–June 2017) and 33-month GRACE-FO (June 2018–April 2021) CSR, JPL and GFZ data. The data are available at: https://podaac-tools.jpl.nasa.gov/drive/files/allData/tellus/L3. In this study, we use the term TWS as the arithmetic mean ensemble of equivalent water thickness from the three products, as recommended by Sakumura et al. (2014), owing to a much higher level of reliability than a stand-alone model. For more details about the GRACE and GRACE-FO data, and their applications in the Amazon Basin, see the revision of Fassoni-Andrade et al. (2021).
2.3. Precipitation data
Precipitation dataset for the Climate Hazards Group Infrared Precipitation with Stations (CHIRPS) is analyzed in this study. This rainfall dataset combines satellite and rain gauges data and uses the global cold cloud duration (CCD) as a thermal infrared method to estimate the global precipitation (Funk et al., 2015). In addition, CHIRPS incorporates a high horizontal resolution (0.05°) climatology (CHPclim), satellite imagery, and in-situ station data to create gridded rainfall time series. The high spatial resolution (0.05°x0.05°) and the temporal coverage (1981–2021) make CHIRPS a suitable satellite precipitation product to study the precipitation variability over the Amazon Basin (see Fassoni-Andrade et al., 2021). In this study we use the CHIRPS V2.0 dataset at monthly tine step, which is available at: https://data.chc.ucsb.edu/products/CHIRPS-2.0/global_daily/.
2.4. Deep convective clouds
The Clouds and the Earth’s Radiant Energy System (CERES) project, launched in 2000, measures the energy fluxes at the top-of-the-atmosphere (TOA) and allows the study of global energy balance, cloud feedbacks and cloud properties (Wielicki et al., 1996). In this study we used CERES Single Scanner Footprint (SSF)-level 3 product to identify the number of days with deep convective clouds (Doelling et al., 2013). These datasets present a horizontal resolution of 1° x 1°, cover the period 2000–2021 and are available at https://ceres.larc.nasa.gov/data/. The edition 4.1 is used. This version incorporates higher time resolution data and additional infrared channels than previous versions, improving the accuracy of high-temporal-resolution fluxes reducing longwave flux biases (Doelling et al., 2016). Following the methodology developed by Xu et al. (2016), we distinguish deep convective clouds based on a set of physically defined criteria. First, deep convective clouds are characterized by a cloud top pressure between 440 and 50 hPa. Additionally, the cloud visible optical depth gives information about the level of transparency of different types of clouds. In this sense, higher values of the optical depth in the visible spectrum imply more scattering due to ice crystals and water droplets. For this reason, while optical depth values greater or equal than ten are characteristic of thick deep convective clouds, smaller values are related to thinner clouds such as cirrus or cirrocumulus. As a final condition, more than 99% of the pixel area needs to be covered by clouds (cloud fraction>0.99). Grid cells where these three conditions are accomplished are labeled as areas with deep convective clouds.
2.5. Ocean-atmosphere data
In this study we analyzed zonal and meridional wind, vertical motion (vertical velocity), and specific humidity at pressure levels between 1000 and 200 hPa from the European Center for Medium-Range Weather Forecasts (ECMWF) reanalysis ERA5 (Hersbach et al., 2020) dataset. In addition, vertically integrated water vapor flux and its divergence from the ERA5 reanalysis are also analyzed for each year characterized by extreme floods in Amazonia. This new generation reanalysis of the ECMWF is available at a horizontal resolution of 0.28° × 0.28° (31 km) at hourly time-step. However, in this study, mean monthly values for the period 1979–2021 are used. These data were extracted from the Climate Data Store (CDS) of the Copernicus Climate Change Service (C3S) (https://cds.climate.copernicus.eu/).
Sea surface temperature (SST) variability is analyzed using monthly means values of the NOAA extended reconstructed SST V5 (Huang et al., 2017) for the period of 1979–2021. This information has a global coverage at 2°x2° of horizontal resolution and is available at http://www.esrl.noaa.gov/psd/data/gridded/data.noaa.ersst.v5.html.
3. Main hydrological characteristics at Manaus station
3.1. Long term variability of river levels at Manaus
The flood pulse of the Negro River monitored at Manaus is a large-scale integrator of rainfall seasonality of a catchment with more than 3 million km2 over northwestern Amazon Basin (Ronchail et al., 2006; Schöngart and Junk, 2007) (Fig. 1a). Due to its extension in both hemispheres, the Amazon Basin includes regions with various rainfall and consequently discharge regimes (Espinoza et al., 2009a). Therefore, rainfall anomalies during the extended wet season (October to March) are related to river anomalies on the Amazon main stem 3–4 months after the peak rains (e.g., Satyamurty et al., 2013; Marengo and Espinoza, 2016). Because the peak of the rainy season in southern Amazonia is during December–February, the peak in the river levels with basins located in the southern part is reached in February–April, while rivers with basin in central Amazonia, such as Manaus, show their peak flows in May–June (Fig. 1a).
Considering the 10 highest annual water levels recorded at the Port of Manaus during the last 119 years, half of the events occurred during the last 10 years (2021, 2012, 2015, 2014 and 2019, in descending order), including the two biggest flood events in 2012 and recently in 2021 (Fig. 1a and b). The year 2012 has featured a “once in a century” extreme seasonal events in tropical South America: the record flooding in the Amazonia region that surpassed the previous record extreme in 2009 (Marengo et al., 2013; Espinoza et al., 2013; Satyamurty et al., 2013; Filizola et al., 2014). In contrast, extreme droughts were also reported during the low water season of 1997–98; 2005; 2010 and 2015 (Marengo and Espinoza, 2016; Jimenez et al., 2016, 2019). Consequently, the amplitude of the river level increased by about 1.5 m in the last three decades compared to the period 1903–1990 (Schöngart and Junk, 2020) (Fig. 1b).
3.2. Main hydrological features of the 2021 flood
Above normal water levels of port of Manaus were observed early in 2021, with a rapid increase from 21.26 m on January 1st to 24.02 m on January 26th (Fig. 1a). In the continuity of the intensification of Amazon flooding, the water level passed already on April 30th the emergency situation (29.0 m). On June 5th the water level attained the 30.0 m and achieved in June 16th its maximum water level of 30.02 m. This is the highest water level in 119 years, even higher than the previous record of 29.97 m observed on May 29th, 2012 (Fig. 1a and b). Over the period of an entire month the water level in 2021 stayed above the previous maximum water level of 2012. On June 30th the levels at Manaus dropped to 29.96 m. The flood washed away some small patches of subsistence agriculture carried out by traditional communities for perhaps centuries, and threatening food security. According to the Brazilian Geological Survey CPRM (www.cprm.gov.br) the normal level at that time of the year is 27 m. By June 21st, according to CPRM, in Barcelos (40 km upstream of Manaus) the Rio Negro reached 10.33 m, higher than the previous record of 10.32 m in 1976.
The increasing frequency and magnitude of floods recorded at the Port of Manaus, which passed over the critical threshold of flood emergency situation (≥29.0 m), is also reflected by the duration of the emergency situation (Fig. 1c). During the period 1903–2008 (106 years), the sum of the duration of the emergency situation was 400 days. During the last 13 years (since the 2009) the total duration of the emergency situation in Manaus was 475 days. However, this situation may increase once the hydrological year 2020–2021 end in September. This corresponds to an almost tenfold increase in the average duration of the emergency situation per year between the first 90% (3.8 days/year) and the last 10% (36.4 days/year) of the instrumental record. During the last 10 years, Manaus had in total an emergency situation lasting for over one year.
3.3. Anomalies of terrestrial water storage during the extreme flood years
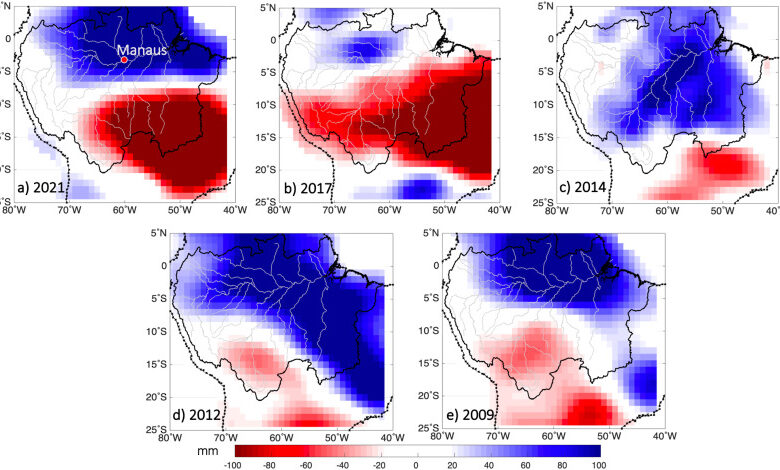
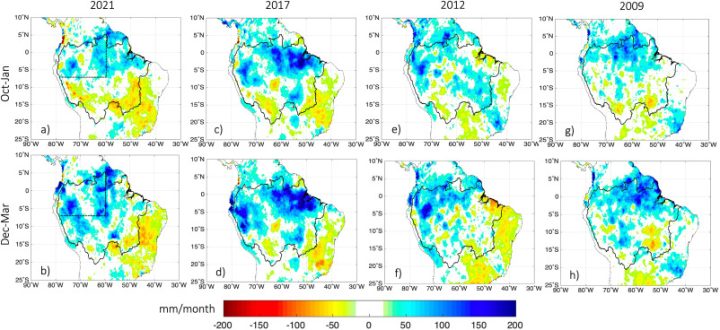
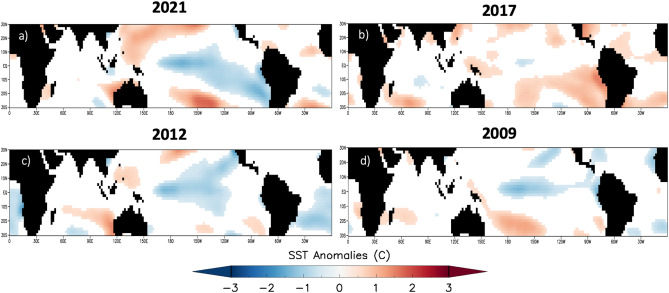
In terms of terrestrial water storage (TWS), December–March 2021 is characterized by strong positive anomalies over the northern Amazonia (80–100 mm above normal) covering most of the northern and northwestern Amazon tributaries (Fig. 2a). Positive TWS anomalies over northern Amazonia are also observed in previous extreme flood years of the 21st century, such as in 2012 and 2009 (Fig. 2d and e). However, this spatial pattern is not observed during 2014 flood, where positive TWS values appear over the Madeira River and Southern Amazonia (Fig. 2c) and where record floods were detected in the states of Acre and Rondônia in western Brazilian Amazonia during summer of 2014 (for the location of states and countries, see Fig. 1a). Fig. 2b shows December–March TWS anomalies associated with the 2017 flood, characterized by high rainfall amounts (see Section 4.1). However, during 2017 weak positive TWS anomalies are more locally observed, mainly over the northern Brazilian Amazon and Colombian Amazon. Among extreme flood years, positive TWS anomalies over western Amazonia (Peruvian and Ecuadorian Amazon) are only detected during 2012, while neutral values are observed during 2009, 2014, 2017 and 2021. This spatial pattern is coherent with the highest discharge values observed in the Peruvian Amazon River in 2012 (Espinoza et al., 2013), however no extreme floods occurred in 2009, 2014 and 2021. While positive TWS anomalies are observed in the northern Amazonia in 2009, 2012, 2017 and 2021, these years are characterized by negative TWS anomalies in the southern Amazonia, particularly over the southern Brazilian and Bolivian Amazon regions. Indeed, most of the Bolivian and southern Brazilian Amazon showed TWS anomalies of −100 mm in 2021 and 2017 (Fig. 2a and b).

4. Atmospheric features related to the recent extreme floods
4.1. Rainfall and convective patterns during the extreme flood years
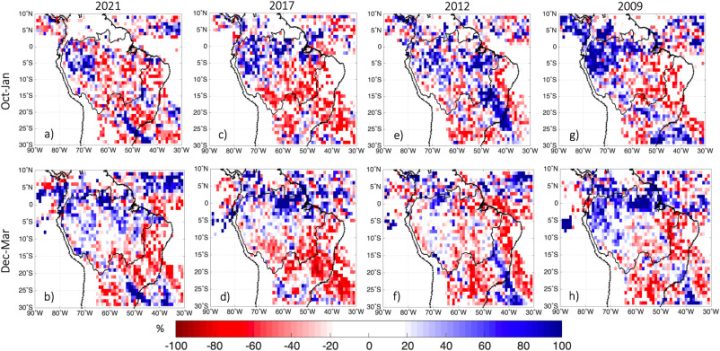
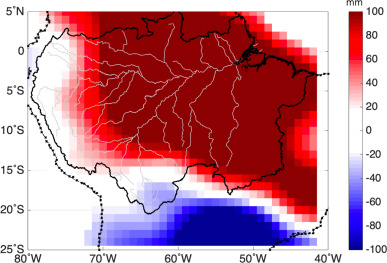
Rainfall anomalies during the extreme flood years of the 21st century are analyzed in this section. Despite the 2014 event, where extreme flood is associated with exceptional rainfall over the upper Madeira Basin in the southern Amazon-Andes transition zone (Espinoza et al., 2014), rainfall patterns during 2009, 2012, 2017 and 2021 show similar characteristics. During these events above normal rainfall is observed during the extended wet season (October–March) over northern Amazonia (Fig. 3). During 2009 rainfall anomalies were higher over northeastern part of the basin, while during 2012 rainfall was particularly above normal over the northwestern Amazonia. During the most recent extreme floods (2017 and 2021) rainfall were higher than normal in both northwestern and northeastern Amazon. In addition, negative rainfall anomalies are observed over the Southeastern Amazonia and over the Brazilian Cerrado region (including the MATOPIBA region), which are suffering dry conditions since the 1980s (Marengo et al., 2021; Espinoza et al., 2021). This contrasting North (wet) – South (dry) rainfall pattern is coherent with the TWS anomalies characterized by positive (negative) anomalies over northern (southern) Amazonia (Fig. 2). However, during 2021 event this dipole north-south pattern is stronger, both in terms of rainfall and TWS anomalies (Fig. 2, Fig. 3 a,b).
Download : Download high-res image (2MB) Download : Download full-size image
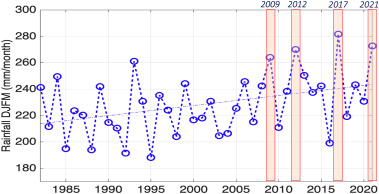
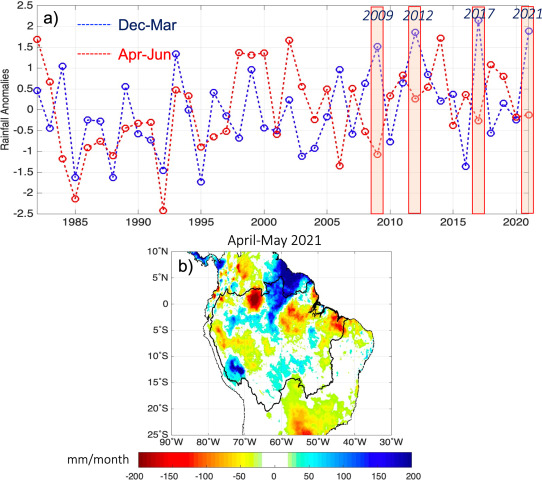
Over northwestern Amazonia a significant rainfall increase is detected during the December–March season for the period 1982–2021 (τ = 0.38; p < 0.05) according to a Kendall test (Kendall, 1975). Very wet conditions (monthly values higher than 260 mm/month) are observed during 2017, 2021, 2012 and 2009 (in descending order; Fig. 4). Over this region, mean December–March seasonal rainfall increase in magnitude and variability from 220 mm/month (coefficient of variability of 0.09) before 2006 to 242 mm/month (coefficient of variability of 0.10) after this date. This change is significant at p < 0.05 according to a Pettitt test (Pettitt, 1979), even considering that two of the major hydroclimatic droughts were reported in 2010 and 2016 (Fig. 4). While an exceptional rainy season was reported during December–March 2017, and water level at Manaus achieved above 29 m (Fig. 1b), this event is not among the historical floods in terms of duration of the emergency situation (Fig. 1c). This can be explained by the extreme dry conditions reported during the El Niño episode of 2015–2016 (Jimenez et al., 2016) where December–March rainfall was below 200 mm/month (Fig. 4). This drought situation is remarkable in TWS anomalies with anomalies lower than −100 mm in most of the Amazon Basin during December–March 2016 (Fig. S1). Therefore, the extreme rainy season of December–March 2017 occurs under very low conditions of water storage over the basin. Consequently, despite high rainfall amounts, weak positive TWS anomalies are observed in 2017 (Fig. 2b) and water level reach emergency situation during few days (Fig. 1c). Considering the April–May season, rainfall over northwestern Amazonia is not associated with the extreme flood years. Indeed, rainfall anomalies during April–May 2021, 2017, and 2009 are negative over northwestern Amazonia upstream of Manaus station and rainfall anomalies are barely positives in 2012 (Fig. S2).
Download : Download high-res image (355KB) Download : Download full-size image
The extreme floods of 2009, 2012, 2017 and 2021 are also characterized by high frequency of deep convective clouds over northwestern Amazonia. Comparing to normal years of the 21st century, extreme flood years show among 40–80% more frequency of deep convective clouds over northwestern Amazonia, particularly during the beginning of the wet season (October–January; Fig. 5). Fig. 5 also shows that these years are characterized by lower frequency of deep convective clouds over southern and southeastern Amazonia. This north-south contrasting pattern of deep convective clouds over Amazonia is in accordance with previous studies that documented an intensification of the Hadley circulation with and enhanced ascending motion over northern South America and subsidence over southern and southeastern Amazonia (Espinoza et al., 2019a; Funatsu et al., 2021; Marengo et al., 2021). Our analysis of TWS, rainfall and deep convective clouds anomalies (Fig. 2, Fig. 3, Fig. 5), clearly show that extreme drought events can occurs in tropical South America simultaneously with floods in northern Amazonia, such as the extreme drought in the northeast of Brazil in 2012 (Marengo et al., 2013) and very dry conditions observed in Bolivian Amazon in 2017 (Espinoza et al., 2019b; Gutierrez-Cori et al., 2021).
Download : Download high-res image (2MB) Download : Download full-size image
4.2. Main features of the atmospheric circulation during the recent extreme floods
During extreme flood events moisture flux from the tropical Atlantic and the Caribbean Sea are intensified, particularly during the December–March season (Fig. 6). However, this intensification can occur sooner, such as during the 2012 flood, which produced an early discharge peak of the Marañón River in the Peruvian Amazon (Espinoza et al., 2013). In addition, a common feature regarding 2009, 2012, 2017 and 2021 floods is the reduction of moisture transport from northern to southern Amazonia by the so called flying rivers (Marengo, 2020), confirmed by southern water vapor flux anomalies over Bolivian and southern Peruvian Amazon (Fig. 6). This feature retain moisture over northern Amazonia, where convergence of water vapor flux is observed (blue color in Fig. 6). In 2009, this convergence is particularly intense over the northeastern Amazonia, where higher rainfall and TWS anomalies are observed (Fig. 2, Fig. 3), while in the 2012, 2017 and 2021 intense convergence of water vapor flux is also observed over the northwestern Amazonia, mainly during December–March season. Fig. 6 also shows that divergence of water vapor flux predominates over southern and southeastern Amazonia during the 2017 and 2021 events, confirming that dry conditions over these regions (Fig. 2, Fig. 3) and lower frequency of convective activity (Fig. 5) are observed simultaneously to floods in northern Amazonia.

Download : Download high-res image (2MB) Download : Download full-size image
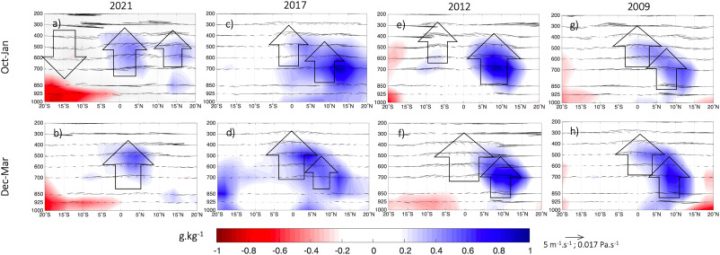
Analyzing a latitude-pressure level cross section, Fig. 7 shows an intensification of upward motion over northern Amazonia during the extreme flood years, which is associated with a major frequency of deep convective clouds (Fig. 5) and positive anomalies of specific humidity (blue color in Fig. 7). Upward motion is stronger during the 2009 and 2012 events (covering most of the column of the troposphere), while during 2017 intense upward motion is mainly observed in the middle and the upper troposphere (from 700 hPa to 200 hPa). However, during the 2021 event anomalies of upward motion are particularly observed in the mid-troposphere, from 700 hPa to 400 hPa (Fig. 7a and b). Nevertheless, during 2021 and 2017 higher anomalies of specific humidity are observed in northern Amazonia (5°S-5°N; Fig. 7a–d), while in previous flood years the highest anomaly of specific humidity was situated over the tropical North Atlantic. In contrast to previous floods, during the 2021 event an intense subsidence anomaly and negative anomalies of specific humidity are observed over southern Amazonia 10°S-20°S and the Pantanal region explaining the drought situation that affect these regions since the austral summer of 2021 (Figs. 7a and 3a,b). In addition, low-level southern wind anomalies are more intense during 2021 (around 925 hPa – 850 hPa) than compared with previous floods. This mechanism is coherent with an intensification of the continental Hadley circulation over tropical South America during the last October–March season. This intensified circulation is associated with upward motion (ascending branch of the Hadley circulation) and convective activity over northern South America (including northern Amazonia), subsidence and dry conditions over southern Amazonia (downward branch of the Hadley circulation) and southern winds anomalies over southern Amazonia that enhance winds convergence and convection over northern Amazonia (Fig. 5, Fig. 6, Fig. 7). These mechanisms are in accordance with the simultaneous wet and dry conditions observed during the 2021 wet season in the northern and southern Amazonia, respectively, remarkable in both precipitation and TWS anomalies (Figs. 2 and 3).
Download : Download high-res image (771KB) Download : Download full-size image
Associated to upward motion over northern Amazonia, Fig. 8 shows large subsidence anomalies over the central and western equatorial Pacific (around 140°W-180°E), where negative anomalies of specific humidity predominate. These features are in accordance with previous studies that suggest an intensification of the Walker circulation in relation to the intensity of rainfall and subsequent Amazonian floods (Espinoza et al., 2016; Baricivhich et al., 2018). However, during 2021 enhanced mid-troposphere easterly winds are observed from Tropical Atlantic (20°W- 40°W) that transport humidity to northern Amazonia enhancing specific humidity and convective activity over this region (Fig. 5, Fig. 8).

Download : Download high-res image (1MB) Download : Download full-size image
Intensification of the Walker circulation has been related to La Niña events (e.g., Dai and Wigley, 2000) or to an increase in the SST gradient between the tropical Pacific and Atlantic (Barichivich et al., 2018). In according to these studies, the 2021 flood occurs during warm conditions in the Tropical North Atlantic, but the La Niña conditions dominated during austral summer (Fig. 9). According to previous studies, the warming of the tropical Atlantic increased atmospheric water vapor from the tropical Atlantic into the northern Amazon Basin (e.g., Gloor et al., 2015), which is coherent with the intensification of easterly winds at mid-troposphere from the Atlantic Ocean to the northern Amazonia observed in Fig. 8a and b. According to Fig. 9, a common characteristic during the extreme floods of the 21st century is the presence of negative SST anomalies over the central-western equatorial Pacific, particularly during 2021, 2012 and 2009. In fact, after removing the long-term trends of the time series for the period 1982–2021, the interannual December–March rainfall variability over the northwestern Amazonia is negatively correlated with SST over the central and western equatorial Pacific (mainly 140°W to 180°W) and over the Indian Ocean (Fig. 10a). This pattern indicates that positive (negative) rainfall anomalies are frequently observed over northwestern Amazonia during La Niña (El Niño) years independently of the long-term rainfall trend (Fig. 4). December–March rainfall variability over the northwestern Amazonia is also significantly correlated with ascending motion at 500 hPa over northern Amazonia, tropical north Atlantic and Indo-Pacific oceans (blue color in Fig. 10b), while downward motion at 500 hPa is observed over the central and western equatorial Pacific (orange/red color in Fig. 10b). These results show that an intensification of Walker circulation and La Niña conditions are related to upward motion and positive rainfall anomalies over northwestern Amazonia during December–March season (Fig. 10). However, these oceanic and atmospheric patterns have been intensified during the 2021 austral summer (Fig. 8, Fig. 9a), also characterized by an intensification of Hadley circulation (Fig. 7a), which enhanced wet conditions during the extreme 2021 flood.
Download : Download high-res image (428KB) Download : Download full-size image

Download : Download high-res image (1MB) Download : Download full-size image
5. Summary and concluding remarks
In central Amazonia prolonged and severe flooding destroys crops and pastures, contaminates water supplies, and cuts people off from their homes for weeks or even months at a time. Flooding also alters surface hydro-biochemical cycles impacting downstream ecosystems. In June 2021 a new historical record flood was reported in the Amazon Basin, surpassing the once-in-a-century flood of 2012. This new flood producing an emergency situation at Manaus (Brazil) for 91 days, simultaneously to the COVID-19 health and medical emergency. The water level at Port of Manaus reached 30.02 m, surpassing even the previous historical flood of 2012 of 29.97 m.
So far there is no official information on the economic losses. Some preliminary estimates are disseminated mainly by different media channels. By the end of May 2021, according to the Instituto de Desenvolvimento Agropecuário e Florestal Sustentável of the Amazonas State IDAM (www.idam.am.gov.br) the flood generated economic impacts of 201,6 million R$ (40 US million) for the rural sector, impacting more than 450 thousand people. In comparison, the damages during the 2012 flood were about R$ 102 million (20 US million) affecting 125,000 people in the rural sector of the State of Amazonas, and in 2009 the damages were about 50,5 million R$ (10 US million) for the rural sectors of the Amazonas State. These are very preliminary numbers until May 2021 only referring to the rural sectors of the State of Amazonas. However, impacts are much larger, affecting human health especially in urban zones where the population is in contact with untreated wastewater, and where many socioeconomic sectors and public services are affected, such as education, commerce, infrastructure, public and private properties among others. Overall, 48 of the 62 municipalities of the State of Amazonas declared emergency situation until June 2021.
The 2021 flood is associated with abundant rainfall due to an intensification of the atmospheric upward motion and convection in the northern Amazonia (5°S-5°N). This is related to an intensification of the upward branches of the Hadley and Walker circulations. This atmospheric feature is associated with an enhanced (weakened) deep convective clouds and intense (weak) rainfall over the northern (southern) Amazonia since October 2020, that produce positive (negative) anomalies of terrestrial water storage over northern (southern) Amazonia. As documented in the previous major floods of the 21st century (2009 and 2012), the 2021 flood also occurs under La Niña conditions in the central equatorial Pacific; however, in 2012 flood conditions are observed early over northwestern Amazon tributaries, since October 2011. In addition, warm conditions are observed over the tropical Atlantic during December 2020–March 2021. In accordance with this feature, increased atmospheric water vapor is imported by easterly winds from this oceanic region into the northern Amazon Basin.
During the last ten years seven extreme flood events occurred in the Central Amazon region, including the two biggest flood events in 2012 and recently in 2021. Under this context, understanding the hydro-climatic mechanism beyond extreme events is of high relevance to assess impacts on population and human activities along Amazon rivers. Understanding the mechanisms of severe flood events is important the development seasonal rainfall forecast systems and hydrological models that allow for a forecast of river flows/levels at the monthly and seasonal scale (Schöngart and Junk, 2007; Chevuturi et al., 2021). Meanwhile, it is extremely important to develop and assess projections of future flood scenarios. While an intensification of Amazon flooding has been documented in Amazonia during the last decades (Barichivich et al., 2018; Espinoza et al., 2019a), La Niña events can enhance the magnitude of the wet season in northern Amazonia (e.g., in 1999; 2009; 2012 and 2021). This suggests that extreme hydrological events in Amazonia are associated with multiple mechanisms involving several spatio-temporal scales (e.g., Espinoza et al., 2014; Erfanian et al., 2017). In addition, Gouveia et al. (2019) evidenced further a feedback mechanism of the intensification of the hydrological regime in Amazonia, due to the increasing discharge of freshwater into the Atlantic Ocean as a consequence of the increasing flood events. The salinity along the main water export route of the Amazon River plume decreased in the last decades by about 3.5% per year (2002–2016). This thickened the barrier layer and reduced the mixture between the lighter and warmer surface water with deeper and colder water of higher salinity contributing to the warming of the tropical Atlantic Ocean.
The influence of increasing land-use change by means of deforestation and fires in the Southern Amazon has been investigated in the past (Sierra et al., 2021, Wongchuig et al., 2021, Wright et al., 2017; Zhang et al., 2009; Costa and Pires, 2010; Lejeune, 2016). These authors highlight the mechanisms by which interactions among land surface processes, atmospheric convection, and biomass burning may alter the timing of wet season onset and seem to be more relevant to enhancement of drought conditions. However, not much is said about floods in northern Amazonia. The early work by Gentry and Lopez-Parodi (1980) and Sternberg (1987) suggest a potential aggravation of floods in the Amazon River as a consequence of deforestation. However, this could be affecting the Upper Amazon region since deforestation has an impact on flooding by the release of sediment, and eroded soil wind up in river beds, shrinking channels and the river’s ability to carry water without flooding. There is a need to focus on studies on the impacts of deforestation in the Amazon flood plain in the timing and magnitude of changes in the Amazon’s hydrology by modelling experiments.
Author statement
All authors contributed to the conception, discussion, and refinement of this manuscript.
Declaration of competing interest
The authors declare that they have no known competing financial interests or personal relationships that could have appeared to influence the work reported in this paper.
Acknowledgements
This research was funded by the following agencies and projects: The French AMANECER-MOPGA project funded by ANR and IRD (ref. ANR-18-MPGA-0008) for JCE. The Brazilian National Institute of Science and Technology for Climate Change Phase 2 under CNPq, grant number 465501/2014-1; Fundação de Amparo à Pesquisa do Estado de São Paulo (FAPESP) grant numbers 2014/50848-9 and 2017/09659-6, the National Coordination for High Level Education and Training (CAPES), grant number 88887.136402/2017-00 and CNPq grant 301397/2019-8 for JM. The Newton Fund through the Met Office Climate Science for Service Partnership Brazil (CSSP Brazil) Predicting the Evolution of the Amazon Catchment to Forecast the Level Of Water (PEACFLOW) project as well as the working group MAUA (Ecology, Monitoring and Sustainable Use of Wetlands) and the Technical/Scientific Cooperation between INPA and the Max-Planck-Society for JS. The authors acknowledge the contribution of S. Wongchuig and JP Sierra-Perez (AMANECER-MOPGA) for the preprocessing of TWS and deep convective cloud data. The first author dedicates this study to the memory of Pascal Fraizy (1960-2021), whose work greatly advanced the understanding of Amazonian hydrology.
Appendix A. Supplementary data
The following are the Supplementary data to this article:
Download : Download high-res image (401KB) Download : Download full-size image
Download : Download high-res image (891KB) Download : Download full-size image
References can be found at the original article.