Guest Essay by Kip Hansen — 12 February 2023
NOTE: I wrote the original two-part series nearly five years ago now. This reprise has been prompted by a conversation with a colleague who’s only understanding of Climate Change or Global Warming has been gleaned from NPR/CNN/PBS and Main Stream Media. I thought to update this essay to see if I would have the same opinions today as I did five years ago. Updated text will be in this lighter blue color. Changed or added images will be clearly labelled.
Note: Please read Part 1 before reading this — this is a continuation of that essay (a rather long continuation….the reprise version is long too, 4000 words but has a lot of graphs)
The last point I made in Part 1 of this essay was this:
The IPCC in their synthesis report for policy makers says that human emissions of greenhouse gases [“atmospheric concentrations of carbon dioxide, methane and nitrous oxide”] and “other anthropogenic drivers,” are “extremely likely to have been the dominant cause of the observed warming since the mid-20th century.”
The IPCC AR6 Summary for Policy Makers uses this wording:
“It is very likely that well-mixed GHGs were the main driver of tropospheric warming since 1979…” AR6 SPM A.1.3
It is notable that they no longer say “dominant cause of the observed warming since the mid-20th century” but rather, as I stated many times in comments to the Reprise of Part 1, 20th century warming doesn’t really get going until 1978/79 or so – not 1950 as many still claim.
So far, I agree with all the facts [the facts being basically: Global Warming is happening and Human activity causes [some of] it.] but don’t agree with the assertion that CO2 and other anthropogenic emissions are “the dominant cause of the observed warming since the mid-20th century.” — I agree neither with the attribution or the effect size.
Nor do I agree that “It is very likely that well-mixed GHGs were the main driver of tropospheric warming since 1979…” AR6 SPM A.1.3
Why? For the simple reason that real scientific evidence for this view is very weak. The IPCC in AR5 SPM offers only this:
“The atmosphere and ocean have warmed, the amounts of snow and ice have diminished, and sea level has risen.” — AR5 SPM 1.1
The new IPCC AR6 now states instead: “It is unequivocal that human influence has warmed the atmosphere, ocean and land. Widespread and rapid changes in the atmosphere, ocean, cryosphere and biosphere have occurred.” And GHG emission are no longer singled out – but rather reduced to a claim of: ”human influence”. Human influence includes land uses changes such as agriculture, road construction, and deforestation, Urban Heat Island, all anthropogenic emissions and pollutants and various anthropogenic Particulate Matter.
That’s the sum total of the evidence, though the IPCC AR5 is hundreds of pages in four booklets, they are just additional verbiage on these basic points.
Readers will have heard the line “multiple lines of evidence” attached to the attribution of anthropogenic causes. However, that phrase is used only once in AR5 SPM as “Multiple lines of evidence indicate a strong, consistent, almost linear relationship between cumulative CO2 emissions and projected global temperature change to the year 2100….” I’m sure I don’t need to point out that there is never ever evidence about the future…..They do not claim in the Summary for Policy Makers that there are multiple lines of evidence for the attribution statement that apply to the past-to-present.
AR6 SPM, however, uses the phrase nine times, such as “Physical climate information at global, regional and local scales is developed from multiple lines of evidence, including observational products, climate model outputs and tailored diagnostics.”
That it has warmed is not in question, we covered this in Part 1. As for sea level, not yet touched on, we will look first at typical visuals offered, one from the IPCC AR5 SPM and then turn to the well-accepted Grinstead et al. 2009 paper: “Reconstructing sea level from paleo and projected temperatures 200 to 2100AD” which serves up the visual depiction on the left, IPCC on the right:
On the left is from Grinstead 2009 starting in 1850, and on the left, from the IPCC’s AR5, incongruously starting abruptly in 1900 (I have not modified that image — that is how it is printed).
However, sea level does not begin is inexorable rise 1850-1900, the beginning of the Modern Industrial Era as depicted in so many of the sea level graphs like those offered above. To see this we need to take a closer, deeper look at the data available in the literature:
Ignoring the projections of future sea level rise, let’s just look to see when sea levels started rising in these two “Modelled past sea level” reconstructions. The “Thick black line: reconstructed GSL [Global Sea Level] (Jevrejeva et al., 2006) extended to 1700 using Amsterdam sea level (van Veen, 1945).” All three data sets agree: Jones and Mann (2004), Moberg et al. (2005) and Jevrejeva et al. 2006. Sea level bottoms out at the depth of the Little Ice Age around 1650-1700 and begins a rise that continues to the present. PSMSL Reconsructions page has plenty of data sources.
That sea level has risen is not in question. The primary factor of both Temperature and Sea Level is that they have both been rising much longer than the IPCC’s posited cause — rising greenhouse gases — has existed. Let me put both temperature and sea level side-by-side:
Loehle’s temperature reconstruction on the left, a segment from Moberg’s 2005 sea level reconstruction from Grinstead 2009, and from the IPCC’s AR5, Chapter 13 on the right. Sea level bottoms out at a millennial low around 1650-1800. That’s 200-300 years of temperature and sea level rise — neither starts in 1850, 1880, 1890, or 1900.
So far, I have freely agreed that the Earth’s climate has warmed, that atmospheric concentrations of CO2 have risen, and that sea level has risen. I will even let the Consensus have “the oceans have warmed” — even though I have extreme doubts that we have any real idea of the past temperatures of “the oceans”.
[ We have some clue about the skin temperature of the seas [more correctly: sea surface skin temperature (SSTskin)] from satellite data and a tiny bit of data about the rest from free floating ARGO buoys — but nothing anywhere near enough to estimate the average temperature of the oceans or any changes to that average — in my opinion, that claim is not scientifically supportable at this time.]
Five years later on, the fleet of ARGO buoys has increased and collect more data about the present. There has been no improvement in data sets about past ocean temperatures — at any depth or at the surface — graphs and estimates claiming to show century long records are worse than mere guesses. Here’s an example claiming to have data on ocean temperatures back to 1880:
These two graphs are new to this essay. Note that the shape of the “ocean temperature” graph looks suspiciously close to the GISTEMP graph for 2015, especially before about 1930-40 or so.
I don’t have any expertise on snow cover levels, glaciers, Arctic or Antarctic ice. But here is what Rutger’s Snow Lab has to say about Northern Hemisphere snow cover since 1967 (satellite era):
Surprisingly, Northern Hemisphere snow cover is increasing in the Fall and Winter seasons and decreasing only in the Spring, with the last couple of Springs being about normal. There seems to be more variation in the Fall and Spring seasons, with Winters being less variable.
Updated Rutgers Snow Lab graphs show that things have not changed much. The layout is different than above, reading left to right – fall, winter, spring. Fall snow extent is UP, Winter snow extent is UP, Spring snow extent is DOWN.
This image is new.
Why Northern Hemisphere snow cover? Most of the planet’s snow is in the Northern Hemisphere with the majority of the rest being in Antarctica: [Arctic ice cap not represented.]
Glaciers, extent and growth/shrinkage of, is even more controversial than the rest of climate change — and I am happy to leave that others. Glacier growth is not primarily driven by temperature, but rather by precipitation at the high end of a glacier: “A glacier is a persistent body of dense ice that is constantly moving under its own weight; it forms where the accumulation of snow exceeds its ablation (melting and sublimation) over many years, often centuries.” So, even if glaciers are generally shrinking (some are shrinking and some are growing), it has no particular bearing on warming. Regionally, changes in glacier size and movement can be considered due to changes in regional climate, changes in precipitation being the main factor.
As for Antarctica? Again, too much controversy to say. On 10 July 2017, a NASA study done in 2015 by Jay Zwally was published online in the Journal of Glaciology and was highlighted in this press release: “NASA Study: Mass Gains of Antarctic Ice Sheet Greater than Losses”, It says “A new NASA study says that an increase in Antarctic snow accumulation that began 10,000 years ago is currently adding enough ice to the continent to outweigh the increased losses from its thinning glaciers.” Scientific American beat the original study to press by four days, running a rebuttal on 6 July 2017, written by Shannon Hall, a news report, not a scientific study. Just in case anyone might misconstrue the purpose of the article, they subtly titled it “What to Believe in Antarctica’s Great Ice Debate”. Four days before the original study is published — now that is what I call Rapid Response!
The controversy about Antarctic Ice Mass has not subsided. Zwally et al. re-did their study in 2021 and found that Antarctic Ice Mass had stopped growing but had settled in to a cyclic small gain-and-loss pattern. Below, with a new graph in this essay, you can compare the NASA consensus view (left) , with the NASA Zwally et al. view (right):
It is important to understand that Antarctica is understood consist of 24,380,000 gigatonnes — one gigaton is equivalent to one billion metric tons — the “massive” ice loss in the left-hand NASA graph is 0.00062% or six ten-thousandths of a percent of the total. Zwally find a loss trend of 12 Gt per year, or 0.000049% more than an order of magnitude less, which can rightly be read as “almost nothing”.
There is no doubt about Artic sea ice extent — it has been declining:
The left graph shows the last eight years against 1979-2017 mean — the right graph shows those same eight years (plus 2018) as daily values. The red trace with + marks is 2018 through July.
The National Snow and Ice Data Center offers this:
So, it is obvious (from satellite data) that Winter NH Sea Ice Extent is down about ½ million miles2 (roughly a million km2) and Summer Extent is down, on average, about a million mi2. Changes in Arctic sea ice conditions can affect weather and climate elsewhere. These graphs start in 1976 or so because that is the start of the satellite era.
Again, as with almost all climate issues, there is a controversy. Arctic Sea Ice has been declining — sorry for the lack of originality here — 300 years. Many historical records show that there was a similar decline in the 1930s.
Polyak et al., 2010 shows this controversy in action:
In the Nordic Seas we see in the black boxes low sea ice extents which last just two or three years in the mid-1600s and mid-1700s, and, as expected, in the very warm 1920-1940 period, as per Macias-Fauria et al., 2009 (black trace). The red trace is Arctic max sea ice per Kinnard et al., 2008 which shows the effect of Nordic ice on overall Arctic ice with a dip in the same 1920-1940 period.
Polyakov et al. “The discrepancy between the two records in the early 20th century corresponds to an increase in the Atlantic inflow to the Nordic Seas,” which I would translate as “Nordic sea ice was low during the 1920-1940 period due to a change in Atlantic circulation.” Previous historic low extents in the 1600s and 1700s are not associated with known warm periods. Using Nordic Sea Ice as a proxy (the Danes have kept very good records, being responsible for Iceland and Greenland and points north), we see that Arctic Sea Ice decline can reasonably be said to start in the early 1700s or the late-1700s — definitely not the late 1800s — not 1850-1880-1890 — not the beginning of the Industrial Era.
Arctic Sea Ice has only been tracked with any scientific accuracy since the beginning of the satellite era, like many other global metrics.
But, still, no denial here, Artic Sea Ice is at historic lows, having reached a high point at the depth of the Little Ice Age and falling since then coincident with subsequent warming.
The situation with Sea Ice worldwide also has not changed much. The latest long-term graphs from NSIDC data: (new graph)
Note that the scale on the upper pair of graphs is different than the lower (Antarctic sea ice) graph. The only thing that is NEW in this data is that with a few more years added on (up to date – 2023) there is a shift in 2016 which is visible on the combined graphs (to the right of the added brown vertical line).
Or from NANSEN just for the Arctic:
In Part 1 and the above, I have agreed with all the posited physical facts and the evidence presented by the IPCC for its global warming/climate change position.
There remains one issue that has yet to be addressed, as we can’t assess the IPCC’s position without it.
Is CO2a greenhouse gas? Can, and does, increasing atmospheric concentrations of CO2 and other anthropogenic greenhouse gases cause warming?
Of course it is and of course it can and of course it may have.
Some readers will find this admission offensive, but again there is no reason to deny the physical facts — the Australians explain it like this:
“Greenhouse effect
The greenhouse effect is a natural process that warms the Earth’s surface. When the Sun’s energy reaches the Earth’s atmosphere, some of it is reflected back to space and the rest is absorbed and re-radiated by greenhouse gases.
Greenhouse gases include water vapour, carbon dioxide, methane, nitrous oxide, ozone and some artificial chemicals such as chlorofluorocarbons (CFCs).
The absorbed energy warms the atmosphere and the surface of the Earth. This process maintains the Earth’s temperature at around 33 degrees Celsius warmer than it would otherwise be, allowing life on Earth to exist.”
Why would anyone deny that? It is simply a fact of chemical and energy physics.
I acknowledge that the name “Greenhouse Effect” is a misnomer — Alistair B. Fraser, Emeritus Professor of Meteorology, Pennsylvania State University gives a thorough explanation as to why and how it is a misnomer on his Bad Greehouse page and has a very interesting discussion at Bad Greenhouse FAQ.
The mis-naming of the effect doesn’t change its reality and doesn’t change the absorption of outgoing energy by water vapor, CO2 and the other greenhouse gases. Because energy is absorbed by these gases, the atmospheric temperature is raised. The atmosphere radiates energy, like all physical material, based on its temperature. Some of that radiated energy is absorbed by the Earth itself, the oceans, the plants, the animals — well, everything that it touches. That’s how the system works. It is not correct to say that everything that absorbs this radiation of energy from the atmosphere “heats up”. It is correct to say that it has absorbed energy.
But many insist that we are talking about heat — that is not physically correct — we are really speaking about the conservation of energy. Energy absorb[ed] by the Earth as a “system” takes many forms. Plants absorb energy from the Sun and thorough chemical processing store it as chemical energy in sugars and as chemical energy stored in the tissues of the plant itself. Water molecules absorb energy from the sun and atmosphere and store it as kinetic and potential energy in the water vapor moved higher into the atmosphere which we experience as the energy of water high in the atmosphere falling to Earth: hydroelectric power is derived from that stored energy, flash floods and mudslides are caused by the release of this potential energy. Through life processes, energy is both stored and used by all animals (and humans) to keep their bodies warm and perform work (both internal and external). And, as we are all aware, fossil fuels are fuels because they are that energy stored over geological time spans.
There are recent studies that post that not all ”fossil” fuels were created by live forms (plants etc).
My point in all the above is that not all energy retained in the Earth system is retain as heat measurable by thermometers. The general consensus view sweeps all this energy storing into the statement “the missing heat goes into the oceans”. The energy is not missing, it is being stored in myriad ways. How much energy stored in what forms? We have no idea really. We did recently find out that photosynthesis has increased by >30% due to atmospheric CO2 enhancement — which means >30% more energy being converted by plants
There will be wailing and gnashing of teeth about this, I’m sure. Some will point to the experiments that “prove” that the atmosphere is radiating more energy back to Earth than some time earlier — this is not in question. Yes, of course they do. That is the physical science of so-called “greenhouse gases” and this phenomena is responsible for the Earth being a livable planet.
So what is left?
Now, I have accepted the two basic premises of the Global Warming movement — the two points on which the so-called “97% agree” (so count me among them). I have accepted the lines of evidence that the IPCC offers in support of their hypothesis: “The atmosphere and ocean have warmed, the amounts of snow and ice have diminished, and sea level has risen.” I have even agreed that CO2 is a greenhouse gas and that it is at an historic high.
Why am I still a skeptic?
I am still a skeptic because all of those things, freely accepted more-or-less as claimed, do not add up to anything even near a “proof” of the IPCC hypothesis:
CO2 and other anthropogenic emissions are “the dominant cause of the observed warming since the mid-20th century.”
Note: The IPCC no longer makes that claim in that way. IPCC AR6 now uses: “It is unequivocal that human influence has warmed the atmosphere, ocean and land. Widespread and rapid changes in the atmosphere, ocean, cryosphere and biosphere have occurred” and “It is very likely that well-mixed GHGs were the main driver of tropospheric warming since 1979…”
I would even go as far as to say that the evidence offered up by the IPCC, in their hundreds of pages of painstakingly reviewed and re-reviewed reports does nothing more than present a case for the possibility that the hypothesis could be true.
The IPCC and the Climate Science community have, so far, failed to rule out the CO2 driven global warming hypothesis — nothing more. They have, however, shown in their historical reconstructions that the main bodies of evidence their hypothesis relies on — surface air temperature, sea level rise, snow and ice cover — all started changing long before CO2 concentrations could possibly had any appreciable effect.
It is an accepted tenet of modern science that an Effect cannot precede its Cause. So here I find myself accepting the major offered data as more-or-less valid (close enough for my purposes) and the evidences offered as more-or-less true, yet I find that proposed CO2-driven Global Warming Hypothesis, in order to be true, would require retrocausality, or, in other words, that the Effects have preceded the Cause.
I am a firm proponent of the idea that time flows in one direction only and that the arrow of cause always points forward (past-to-present, present-to-future). That leaves me forced to reject the CO2-driven Global Warming Hypothesis as generally presented.
I am not the first to notice this, of course. The IPCC has thus been forced to alter its original hypothesis and modify it to read that CO2 and other anthropogenic emissions are “the dominant cause of the observed warming since the mid-20th century.”
And now, again in AR6, they have been forced to modify it to read: “It is very likely that well-mixed GHGs were the main driver of tropospheric warming since 1979…”.
That means that CO2 as a driver of climate only became dominate over Factor X since 1950.
More correctly now, well-mixed GHGs became the main driver of tropospheric warming since 1979, dominate over the unknown Factor X that drove the many ups and downs since 1880.
“Factor X?” you may ask. Yes, Factor X is just a place-marker for whatever was causing Global Temperature to rise since the mid-1600s, Global Sea Level to rise since 1650-1700, Arctic Sea Ice to start declining in either the early 1700s, or in 1800 (your choice, either could be supported by the data).
If this sounds fanciful to you, then your critical thinking skills are working properly. There is simply no evidence whatever that the unknown Factor X was responsible for 250 years of rising temperature, rising seas, and declining Arctic ice — only to be superseded by CO2-driven Global Warming in 1950. [now, 1979]
The IPCC Consensus view is that Factor X is “natural variability” — which can be translated into “things that change the climate that we do not recognize as causative and/or do not understand”. The IPCC modified CO2-driven Global Warming Hypothesis thus depends on unknown/not-understood climate forcings (lumped into a basket called “natural variability”) which are then overshadowed by CO2 induced warming (the effect size of which is still unknown and controversial).
As for me and mine, we will wait in the bleachers for evidence to be produced that supports such as hypothesis — something stronger than that offered by so many CAGW apologists in the form “well, what else could it be?”
and more recently “because…”
# # # # #
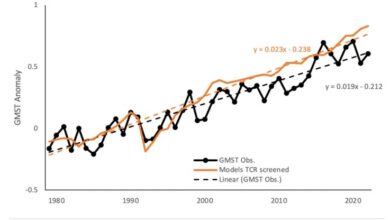
ODDLY ENOUGH: Ollilia (2018) “Challenging the scientific basis of the Paris climate agreement” [ .pdf here ] also uses a Factor X as “The variable labeled “Factor X” is also depicted in Figure 7; it is the difference between the measured 11 years average temperature and the warming effects of CO2, water and ENSO events. Factor X is needed to explain the observed warming. It is a combination of natural forces like the activity changes of the sun.” Not the same as my use above, but amusing. Fig 7 is:
# # # # #
Author’s Comment:
Please, try and stay on topic and discuss this essay — it is certainly broad enough to satisfy most readers. Oh, and please, pretty please, Don’t Feed The Trolls — like feral cats, feeding just encourages them to breed there under the bridge and become real pests.
I hope that I have not trounced your favorite talking points — remember, this is just my view of a very complex, very young and immature science field. I am patiently waiting for it to grow up.
And I am still waiting….reading the comments to the Reprise of Part 1 will show just how unmoving the consensus can be – it has not not grown up at all.
While I am perfectly willing to explain my viewpoint — I do not argue with others.
If speaking to me, please begin you comment with “Kip…” and I’ll be sure to see it. I do read every single comment that appear under all of the essays I write, but in the wild west world of blog comment threads, it is often difficult to figure out who is speaking to who about exactly what. Leading your comments with the name of the person you are speaking to makes this easier for all.
Keep the conversation collegial and try to understand the other person’s point before replying.
Thanks for contributing.
And, thanks for reading.
# # # # #