
Guest “putting 2 and 2 together” by David Middleton
This post is the nucleus of a hypothesis I’ve been trying to develop. It is a “work in progress” and not fully thought out or as organized as I would like it to be. However, I’ve gotten it to the point that I thought I needed to write something up and post it on WUWT to get some feedback.
Two, Number One
A couple of years ago, I authored a post on “ocean deepening,” discussing this article:
Oceans are at their deepest in 250 million years
And they have hardly been deeper in the last 400 million years than now.Lasse Biørnstad
JOURNALIST
PUBLISHED Monday 08. june 2020 – 12:24
“It moves absurdly slowly,” says Krister Karlsen. He is a PhD candidate in Geophysics at the University of Oslo (UiO)’s Centre for Earth Evolution and Dynamics.Karlsen is talking about how the Earth’s tectonic plates move – ever so slowly but surely, every single year. From a human perspective, this happens so slowly that it is almost imperceptible.
[…]
The world map 200 million years ago shows all the continents assembled in the supercontinent of Pangaea, a time when dinosaurs were well on their way to dominating the Earth’s landmasses.
Since then, the continents have been shifting farther and farther apart, and now they may be as far apart as they can be, says Karlsen. Give the Earth a few hundred million years more, and the continents will probably remerge into a new supercontinent. One proposed name for that possible future reunion is Pangaea Proxima, according to New Scientist.
The movements and age of tectonic plates have a great effect on the depth of the world’s oceans. Just over 100 million years ago, the oceans were around 250 metres shallower on average than they are today.
The older the seabed, the deeper it is, according to a new research article by Karlsen and several colleagues at the Centre for Earth’s Evolution and Dynamics.
[…]
Karlsen et al., 2020 is essentially a reconstruction of plate tectonics and the age of the oceanic crust over time.
According to their reconstruction (and others), 100 million years ago, during the middle of the Cretaceous Period, the oceans were about 250 meters shallower than they are today *and* sea level was about 250 meters higher than it is today.

Process that for a moment… The oceans were 250 meters shallower, but the water level was 250 meters higher than it is today. This was due to the geometry and distribution of the ocean basins.
During the Mid-Cretaceous, shallow seas covered many continental interiors…

While the ocean basins were, on average, considerably shallower than they are today.
Two, Number Two
There is an interesting pattern here, the highest sea levels have occurred when the ocean basins were at their shallowest. These were also times when atmospheric CO2 levels and average surface temperatures were generally elevated. The only time when conditions were similar to the Neogene-Quaternary Periods was during the Late Carboniferous (Pennsylvanian) and Early Permian Periods.

This graph didn’t sit well with the CO2-Driven Climate Paradigm crowd, so they decided to “fix” the temperatures by adjusting them to pH values calculated from CO2. We can see that this yields a much better correlation between CO2 and temperature.

Oddly enough, the Royer/Berner temperature curve yields a decidedly non-catastrophic equilibrium climate sensitivity of about 1.3 °C per doubling of CO2:

It’s worth noting that the Royer pH-corrected temperature data indicate unreasonably warm temperatures during Paleozoic glacial periods.
The analysis of Royer et al. (2004) assumes an unrealistically high pH correction. First, it neglects the ice-volume effect, which changes the relation between δ18O and ∆T. Second, this large pH correction implies high temperatures for seawater even during times of extensive glaciations.
Moreover, the analysis of Royer et al. (2004) consists of boot-strapping, by introducing a correction to ∆T that is an implicit function of RCO2. It is then not surprising that a correlation between ∆T and RCO2 is obtained. This would be the case irrespective of the RCO2 model utilized.
A proper analysis, which avoids this bootstrapping and considers a more realistic pH correction, shows that the global temperature sensitivity to CO2 is still relatively small.”
Forming a hypothesis
Over the past few years, I’ve been trying to develop a hypothesis that links the depths and general geometries of Earth’s ocean basins to average global temperatures and atmospheric CO2. The generally accepted hypothesis holds that weathering rates of silicate rocks governed the atmospheric concentration of CO2 (Berner & Kothavala, 2001). This is the basis of the GEOCARB model of Phanerozoic CO2.
Way back in the Pleistocene (1976-1980), when I was a young geology student, the notion of CO2 as a driver of climate change was largely scoffed at…
Suggestion that changing carbon dioxide content of the atmosphere could be a major factor in climate change dates from 1861, when it was proposed by British physicist John Tyndall.
[…]
Unfortunately we cannot estimate accurately changes of past CO2 content of either atmosphere or oceans, nor is there any firm quantitative basis for estimating the the magnitude of drop in carbon dioxide content necessary to trigger glaciation. Moreover the entire concept of an atmospheric greenhouse effect is controversial, for the rate of ocean-atmosphere equalization is uncertain.
Dott, Robert H. & Roger L. Batten. Evolution of the Earth. McGraw-Hill, Inc. Second Edition 1976. p. 441.
Sometime after 1980, a new paradigm emerged, suggesting that Phanerozoic Eon climate change had largely been driven by CO2 (Royer et al., 2004). The model was that the weathering rates of silicate rocks governed the atmospheric concentration of CO2 (Berner & Kothavala, 2001) and that CO2 was the “control knob” for temperature. However, I’ve noticed problems with this paradigm in the Eocene, Miocene and Pliocene Periods. It may be time for a paradigm shift.
Putting Two and Two Together
Assuming the Royer/Berner temperature is valid (a YUGE assumption), it would appear that either CO2 drives temperature or vice versa… Or something else drives both CO2 and temperature. I recently came across an excellent reconstruction of Phanerozoic sea level. Chris Scotese (of PaleoMap fame) is one of the coauthors. They reconstructed the two primary components of sea level change: plate tectonic eustasy (green curve) and glacial-eustasy (light blue curve) and combined them into a tectono-glacio-eustasy (dark blue curve). Unsurprisingly, sea level changes over the past 540 million years have been mostly driven by plate tectonics.
The Scotese temperature reconstruction from the Geocraft article has a pretty good fit to the van der Meer sea level reconstruction:

While Berner’s GEOCARB exhibits a secular decline in atmospheric CO2 over the Phanerozoic Eon, the Late Carboniferous and Neogene-Quaternary are strikingly similar.

It’s important to note that sea level reconstructions are, by nature, highly uncertain. Notice how widely the three reconstructions vary, particularly during the Paleozoic Era.

Between temperature, CO2, sea level and ocean depth reconstructions, there is no lack of uncertainty. Uncertainty is pervasive in geology and climatology. However, I’m still intent on putting two and two together here.
The first two….
Oceans are at their deepest in 250 million years
[…]The world map 200 million years ago shows all the continents assembled in the supercontinent of Pangaea, a time when dinosaurs were well on their way to dominating the Earth’s landmasses.
Since then, the continents have been shifting farther and farther apart, and now they may be as far apart as they can be, says Karlsen. Give the Earth a few hundred million years more, and the continents will probably remerge into a new supercontinent. One proposed name for that possible future reunion is Pangaea Proxima, according to New Scientist.
The movements and age of tectonic plates have a great effect on the depth of the world’s oceans. Just over 100 million years ago, the oceans were around 250 metres shallower on average than they are today.
The older the seabed, the deeper it is, according to a new research article by Karlsen and several colleagues at the Centre for Earth’s Evolution and Dynamics.
[…]
The second two…
There is an interesting pattern here, the highest sea levels have occurred when the ocean basins were at their shallowest and the continents were relatively closer together. These were also times when atmospheric CO2 levels and average surface temperatures were generally elevated. The only time when conditions were similar to the Quaternary Period was during the Late Carboniferous (Pennsylvanian) and Early Permian Periods.
WUWT
The funny thing is that the highest sea levels have occurred when the ocean basins were at their shallowest and the continents were closest together.
Rates of mid-ocean ridge spreading determine the average age of the ocean floor and therefore, according to the depth/age relationship of cooling oceanic crust (Parsons and Sclater, 1977; Stein and Stein, 1992), control the volume of the ocean basins. Assuming a constant volume of sea-water and conservative estimates of continental hypsometry, the changing volume of the ocean basins directly dictates first-order mean eustatic sea level at > 10 Myr timescales (Conrad, 2013; Miller et al., 2005; Simmons et al., 2020; van der Meer et al., 2017).
While it is an assumption, it is an assumption based on what is understood about the geological histories of plate tectonics and sea level variations. Tectonic eustasy moves sea level up and down by altering the shapes of the ocean basins. Glacial-eustasy moves sea level up and down by moving water back and fourth between the oceans and continental ice sheets and glaciers. Neither process appears to require the net addition or subtraction of seawater over the past 540 million years. It appears that water added by volcanic outgassing and cometary impacts has been roughly balanced by the water subducted into the lower crust and mantle. Glacial-eustasy has rarely been a significant factor during the Phanerozoic Eon.
The deeper the oceans, the more CO2 they can store. According to my Stratigraphy & Sedimentation textbook, Principles of Sedimentology by Friedman and Sanders…
When the pH of seawater decreases, calcium carbonate dissolves. In warm, shallow seas, at a pH of about 8.3, dissolution of aragonite and calcite particles by inorganic processes is almost nonexistent. However, since the classical studies of the Challenger expedition, it has been known that the proportion of calcium-carbonate particles in seafloor sediments decreases as depth of water increases (Table 5-1). Such decrease is particularly rapid at depths between 4000 and 6000 m. Although the reasons for this decrease have been debated, the evidence suggests that calcium carbonate dissolves because the CO2 concentration increases with depth. The control on CO2 appears to be part biological; it results from biological oxidation of organic-carbon compounds. Also, the water masses at greater depth were derived from the polar region; their temperature is lower and the water contains more dissolved CO2. Increased concentration of CO2 is in turn reflected by lower pH, which leads to calcium carbonate dissolution. However, the increase of pressure with depth may also be involved; such increase affects the dissociation of carbonic acid (Eqs. 5-11 and 5-12). The depth at which the calcium-carbonate decreases most rapidly is known as the carbonate-compensation depth, defined as the depth at which the rate of dissolution of solid calcium carbonate equals the rate of supply.
Friedman and Sanders
A very thorough, easy to read, description of the relationship between CO2 and seawater pH… However, the phrase “ocean acidification” is notably absent from the entire 300+ pages. How is this possible?
Even way back then, we knew that past atmospheric CO2 concentrations were often much higher and the oceans had oscillated between calcitic and aragonitic seas during periods of high and low atmospheric CO2 concentrations. The graph below is more or less a cartoon; but it demonstrates that during the Phanerozoic Eon, the only two periods when magnesium-enriched calcite and, less abundantly aragonite, dominated marine geochemistry were from the Mid-Carboniferous to the Late Triassic Periods and the Neogene to Quaternary Periods (~35 MYA to today).
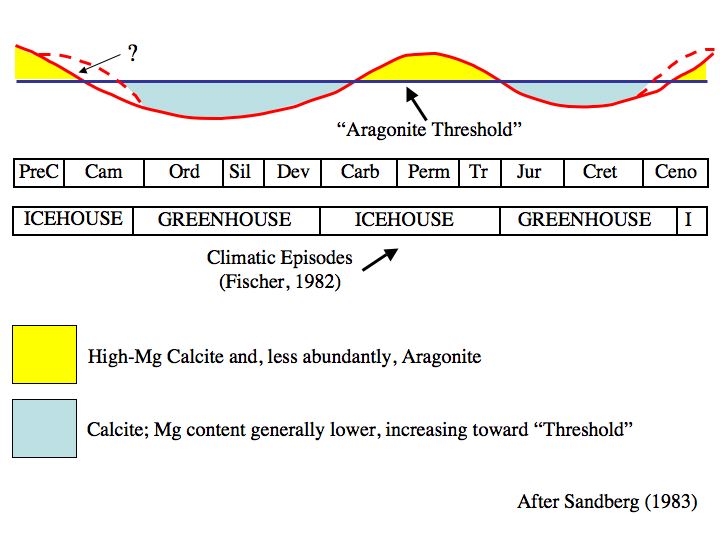
These two time periods also featured deeper ocean basins, ice sheets over one or both polar regions, relatively extensive alpine & valley glaciation, low concentrations of atmospheric CO2 and generally cool to cold climatic conditions.
The CO2 storage capacity of deep oceans (3,000m water depth) is massive. It us so massive that some have suggested injecting it at the seafloor in deepwater.
CAPACITY
Oceans occupy more than 70% of the Earth’s surface and have an average depth of about 3.8 km. Considering the saturation concentration of CO2 in seawater, this storage capacity is orders of magnitude greater than the capacity needed to absorb the CO2 produced by burning all of the world’s fossil fuel resources, equivalent to an estimated 5000 to 10,000 GtC.
Now, I’m not advocating doing this. It would be prohibitively expensive and likely to cause actual environmental harm. I’m just noting that the inventor of the phrase, “ocean acidification,” thinks this is worth looking into.
The oceans know what to do with CO2:
CO2 exists in seawater in various forms as part of the carbonate system:
The relative proportions of these species are defined by the pH of the solution and by equilibrium relationships. Dissolving additional CO2 increases production of hydrogen ions (decreasing pH), but the change is buffered by conversion of carbonate into bicarbonate. Thus, the principal reactions for CO2 dissolution in seawater are as follows:
The CO2 that has accumulated in the shallower waters of the oceans will eventually find its way to deeper waters anyway via the biological carbon pump. It will just take much longer than capturing it and injecting it.
I think that changes in the depths of the ocean basins, over geologic time, has moved the carbonate compensation depth (CCD) up and down and that this is Earth’s primary control knob for atmospheric CO2. Periods with shallower ocean basins have generally had shallower CCD’s, higher concentrations of atmospheric CO2 and generally warmer temperatures. I think changes in the depths of the ocean basins can largely explain these things. While there clearly is some relationship between CO2 and temperature, I don’t think it’s the dominant factor in either direction over geologic time. I don’t consider the ~100,000 year Late Pleistocene glacial cycles, when temperature changes clearly drove changes in atmospheric CO2, to be geologic time. These short-term fluctuations aren’t resolved over 10’s of millions of years. Nor do I consider changes over the past 150 years to be geologic time. This is literally “noise.” This hypothesis I’m trying to develop, will try to explain changes over millions to tens of millions of years.
Any suggestions as to how to proceed would be helpful Of course, if the hypothesis has so little merit, that I shouldn’t waste any more time on it, please let me know.
Now I just have to work out the details… Stay tuned for more posts on this topic.
References
Adams, EE, Caldeira, K, 2008. Ocean Storage Of CO2, Elements 4 (5):319-324, DOI: 10.2113/gselements.4.5.319.
Berner, R.A. and Z. Kothavala, 2001. “GEOCARB III: A Revised Model of Atmospheric CO2 over Phanerozoic Time”, American Journal of Science, v.301, pp.182-204, February 2001.
Dott, Robert H. & Roger L. Batten. Evolution of the Earth. McGraw-Hill, Inc. Second Edition 1976. p. 441.
Friedman, G.M. and Sanders, J.E. (1978) “Principles of Sedimentology”. Wiley, New York.
Goswami, A.; Hinnov, L.; Gnanadesikan, A.; Young, T. Realistic Paleobathymetry of the Cenomanian–Turonian (94 Ma) Boundary Global Ocean. Geosciences 2018, 8, 21.
Karlsen, Krister S., Mathew Domeier, Carmen Gaina, Clinton P. Conrad,
A tracer-based algorithm for automatic generation of seafloor age grids from plate tectonic reconstructions, Computers & Geosciences, Volume 140, 2020, 104508, ISSN 0098-3004, https://doi.org/10.1016/j.cageo.2020.104508.
Royer, D. L., R. A. Berner, I. P. Montanez, N. J. Tabor and D. J. Beerling. “CO2 as a primary driver of Phanerozoic climate”. GSA Today, Vol. 14, No. 3. (2004), pp. 4-10
van der Meer, Douwe G., Christopher R. Scotese, Benjamin J.W. Mills, Appy Sluijs, Aart-Peter van den Berg van Saparoea, Ruben M.B. van de Weg. Long-term Phanerozoic global mean sea level: Insights from strontium isotope variations and estimates of continental glaciation. Gondwana Research, Volume 111, 2022, Pages 103-121, ISSN 1342-937X, https://doi.org/10.1016/j.gr.2022.07.014.