by Judith Curry, Jim Johnstone, Mark Jelinek
A deep dive into the causes of the unusual weather/climate during 2023. People are blaming fossil-fueled warming and El Nino, and now the Hunga-Tonga eruption and the change in ship fuels. But the real story is more complicated.
Observations
Starting in June, the global temperatures are outpacing the record year 2016 (Figure 1).

Figure 1. From Copernicus ECMWF
Here is the time series of the monthly surface temperature anomalies from the ERA5 reanalysis (Figure 2). The July 2023 spike was of comparable magnitude to the winter 2016 anomaly which occurred in late winter.

Figure 2.
Here is the time series of the monthly lower atmospheric temperature anomalies from the UAH satellite-based analysis. The July 2023 temperature anomaly remains slightly below the peak 2016 temperature anomalies and comparable to the peak 1998 temperature anomaly.

Figure 3. Plot from Roy Spencer
The spatial variation of July temperature anomalies is shown below (Figure 4). The ERA5 is the long-standing standard for global reanalyses; the JMA-Q3 (Japan) is a new product that uses a more sophisticated data assimilation process, and I expect it to be at least as good as the ERA5. Superficially, the spatial variability looks pretty much the same, but it is informative to compare the regional amounts of warming which differ significantly between the two reanalyses. Warming is greatest in the Antarctic, and lowest in the Arctic. The warming is also very strong over the NH midlatitude oceans.
The polar regions are of particular interest. The Arctic sea ice is healthy – Arctic sea ice extent for July was only the twelfth lowest in the satellite record. Greenland mass balance (snow accumulation minus melt) for July is above average relative to 1980-2010. The Antarctic is a different story. Antarctic winter sea ice is extremely low, much lower than any wintertime observations since the beginning of the satellite record in 1980. The warm anomaly near Antarctica is an effect the reduced sea ice extent, not a direct cause. The Antarctic ozone hole is opening very early.

Figure 4. Plots from Ryan Maue
Global radiation balance
We can gain some insights into what is going on from looking satellite observations of the top of atmosphere (TOA) radiation fluxes (anomalies relative to the period 2000-2023). The net flux at the top of the atmosphere is incoming solar radiation, minus reflected solar radiation minus outgoing longwave (IR) radiation. There is an overall increasing trend (consistent with an overall warming of global temperatures). The signatures of El Nino and La Nina are seen, with net energy loss (negative anomalies) during El Nino years (2002/2003, 2009/2010, 2015/2016) and net energy gain (positive anomalies) during La Nina years (2007/2008, 2010/2011, 2011/2012, 2020/2021, 2020/2022, 2022/2023). The data extends through May 2023, showing a very strong spike in the net radiative flux in April and May.

Figure 5. Data from CERES
Further information is gleaned from considering the individual components of the net TOA radiation flux: anomalies of incoming shortwave (solar) radiation, reflected (outgoing) solar radiation, and outgoing longwave radiation (IR) (Figure 6). There is little trend in the outgoing longwave radiation. You can see the 11-year solar cycle in the incoming shortwave, and in 2023 (approaching the peak of solar cycle 2025) the sun is the brightest it has been for the past 23 years (an increase of about 0.3 W m-2 since 2019). There is an overall decrease in the outgoing shortwave radiation over the time period, particularly since 2015; this decrease in outgoing shortwave radiation has dominated over the longwave in increasing the net flux at the top of the atmosphere since 2015. The decrease in outgoing shortwave radiation (reduced solar reflectivity) arises from some combination of reduced snow/ice cover, decreasing aerosol concentration, and/or few clouds or less reflective clouds.

Figure 6. Data from CERES
Specifically looking at the last point on the graph (May 2023), you see both outgoing longwave and outgoing shortwave negative anomalies, indicating more heat being retained (consistent with positive net flux in Figure 5). This signature could reflect a decrease in high-level cloudiness (both shortwave and longwave effects), impact of reduced ship sulfate aerosols (shortwave), reduced snow/ice extent (shortwave), and a signature from the Hunga-Tonga eruption (shortwave and longwave). All of these factors are arguably in play to some extent; the issue is their relative magnitude.
Perturbations from Hunga-Tonga volcanic eruption (2022) and the reduced injection of sulfate particles from changes to shipping fuel (since 2022) are being widely discussed in the media as the source of the warming. The eruption of Hunga-Tonga volcano in 2022 is associated with a large injection of water vapor (impacting longwave) and smaller injection of sulfate particles (impacting shortwave). Early estimates of their impacts are 0.1 W m-2 for both shortwave and longwave effects, essentially cancelling out for zero impact on the global net radiative flux (Figure 5).
As mentioned in our recent report on State of the Atlantic, in 2020 there was a change in ship fuel regulations (although regional shipping emissions reductions began in 2015). This change in ship fuels substantially (and quickly) reduced the amount of sulfate particles in the atmosphere, which is making low clouds less reflective. You can see the previous impact of sulfur rich ship fuel on the clouds, with highly reflective tracks (Figure 7).

Figure 7. Image pulled from twitter
This change in ship fuel has been estimated to decrease global outgoing shortwave radiation by 0.1 W m-2 (which is associated with a very small level of surface warming). Since low clouds are relatively warm (close to the temperature of the underlying ocean) and cloud infrared emissivity is less influenced by sulfate particles, you don’t see much of a longwave change from the aerosol reduction (so there is no cancellation in longwave and shortwave effects, such as for Hunga- Tonga).
This image of ship tracks (Figure 8) shows that the change in sulfate aerosol forcing is predominantly a NH issue, particularly in the NH midlatitudes. A decrease in outgoing shortwave of 2 W m-2 has been estimated in the main NH midlatitude shipping corridor.

Figure 8. Image pulled from twitter
A comparison of net shortwave radiation anomalies for each hemisphere is shown in Fig 9. Both hemispheres show the same negative trend (decreasing), indicating less reflection of solar radiation. Since 2015, there is some hint of the NH reflecting less shortwave than the SH (potentially associated with reduction of ship sulfate aerosols) with a strong divergence in the NH and SH for the last data point (May 2023); however, there is substantial interannual variability.

Figure 9. Data from CERES
Bottom line. The recent warming in spring/summer 2023 is associated with a spike in the net radiation flux at the top of the atmosphere. This spike reflects a combination of an increase in incoming shortwave, a decrease in high-level cloudiness, impact of reduced ship sulfate aerosols, reduced snow/ice extent, and the Hunga Tonga eruption. The main significance of the change in ship fuel aerosol is the regional variations in the aerosol forcing (not so much the impact on global or even hemispheric mean temperature). The net global impact of Hunga-Tonga on the global radiation balance seems to be close to zero. It will certainly be interesting to see what the TOA radiative fluxes look for June and July.
Surface energy balance
Analysis of the top-of-atmosphere radiative fluxes is informative for hemispheric and planetary scale energy balances. The surface energy balance is of more direct importance in determining upper-ocean and surface temperature tendencies (i.e. changes). The total net surface heat flux is the sum of the turbulent heat flux (combined latent and sensible, which includes evaporation), and net shortwave (solar) and longwave radiative fluxes.
Figure 10 illustrates the anomalous net downward surface heat flux components averaged over May through July, based on NCEP Reanalysis-2 data (seasonal cycle removed). Turbulent heat flux anomalies are primarily responsible for the total net surface heat flux, reflecting the strong influence of surface winds on evaporative and sensible cooling of the surface ocean. Monthly turbulent heat flux anomalies of +20 to +30 W/m2 were the predominant source of continuous monthly warming over most of the North Atlantic and much of the Northern Hemisphere oceans from May to July. The positive turbulent heat flux anomalies that act to warm the surface are associated with weak surface winds, particularly with weak trade winds in the tropics.
Shortwave (solar) surface flux anomalies are most prominent in the tropical Pacific, reflecting anomalous patterns of convective cloudiness that cool the surface, while net longwave fluxes are generally modest in amplitude. Shortwave flux anomalies are positive over the mid latitude NH oceans (warming the surface) particularly the Pacific, which is consistent with some regional influence from the change in ship fuels and reductions in sulfate aerosol. The turbulent heat fluxes are the largest contributor to the net surface heat flux in most regions. Note the extreme turbulent cooling (dark blue) off the coast of Antarctica; this reflects very strong winds from the north that are the main driving factor in the low Antarctic sea ice extent. Also note the anomalous warming in the Gulf of Mexico and Caribbean with anomalous warming from turbulent fluxes, associated with low wind speeds.

Figure 10. Net downward surface heat flux anomalies from May through July 2023.
The SST tendencies (Figure 11) generally reflect the net surface heat flux (Fig 10, lower right), with ocean circulation heat transport patterns acting to modulate the SST tendencies. An exception is near the coast of Antarctica, where the resulting sea ice extent dominates the SST tendencies.

Figure 11. May through July 2023 SST tendencies.
Bottom line: The anomalous global ocean patterns of SST are dominated by surface wind anomalies (driven by atmospheric circulation patterns) that influence the amount of surface cooling from evaporation and sensible heat flux. The strong warming in high latitudes of the Atlantic Ocean is supported by both the surface turbulent fluxes (low wind speed) and solar heating.
Climate dynamics
The radiation balance at the top of the atmosphere, and the spatial variations in the surface energy balance, influence atmospheric and oceanic circulation patterns. Spatial variations of the external radiative forcing signal acts to amplify and modulate the natural internal modes of variability, such as ENSO and AMO. These circulation patterns modify cloudiness which feedback onto the circulation patterns, further complicating the whole thing. With this context, the analysis below provides speculative but physically-based reasoning on the factors in play that are determining the circulations that are relevant to the Atlantic hurricane season.
Warming in the midlatitudes of the NH, with possible contribution from reduced sulfate aerosol, has given the northern branch of the AMO+ new life, which had overall been cooling since 2015.
The midlatitude warming is causing a decrease in the meridional (south to north) heat transport (atmospheric and oceanic) and contributing to a latitudinal shift in the intertropical convergence zone. This may be reflected in the meridional circulation modes (PMM, AMM).
Distorted warming in colder drier areas of the north Atlantic disturbs the vertical velocity patterns, leading to the expansion of the Hadley Cell. Hadley Cells are the low-latitude overturning circulations that have air rising near the equator and air sinking at roughly 30° latitude, with the cells migrating northward and southward with the sun’s annual cycle. Numerous studies have suggested that the sinking branches of Earth’s Hadley circulation and the associated subtropical dry zones have shifted poleward. Current understanding is that most of the recent Northern Hemisphere Hadley Cell widening is consistent with natural variability.
The strong warming in midlatitude oceans seen in summer 2023, partially in response to elimination of the ship fuel sulfates, is supporting the expansion northward of the Hadley Cell. The Hadley Cell expansion is consistent with the Bermuda High being fairly far north this year, with intensified dry air over the subtropical oceans. Note: El Nino is typically associated with a contraction of the latitudinal extent of the Hadley Cell; that is not what we are seeing this year in the Atlantic.
A recent study has linked a poleward shift of tropical cyclone formation to Hadley Cell expansion. Another study cites an upper-level weakening of the rising branch of the Hadley circulation in the deep tropics, possibly induced by the increased vertical stability with warmer SSTs, which has likely suppressed the low-latitude tropical cyclone genesis in most ocean basins.
North Atlantic Ocean – internal variability
Current SST anomalies in the North Atlantic display a characteristic ‘Arc’ pattern (horseshoe), the leading pattern of natural variability and a signature of NAO (North Atlantic Oscillation) and AMM (Atlantic Meridional Mode) (Fig 12). Extreme Arc warmth in June and July followed a steep rise (+0.8°C) since late February, as seen in monthly and daily Arc SST anomalies (Fig. 12, right panels).

Figure 12. Left: SST anomalies over the NE Pacific and North Atlantic, August 10, 2023. Top right: Monthly SST anomalies over the warm North Atlantic ‘Arc’ region. Bottom right: Daily Arc SST anomalies during 2023.
Short-term warming of this magnitude is comparable to changes ( > 0.4°C) over consecutive 3-month periods during winter-spring seasons of 1983, 1987, 1989 and 2010 (Fig. 13). The warming in early 2023 occurred from a relatively warm initial state, bringing Arc SST anomalies to historic highs during the past 1-2 months.

Figure 13. Left: Monthly Arc SST tendencies (red) and anomalies (gray) from January 1982 to July 2023. Tendencies represent changes between consecutive 3-month windows, plotted at the final point of the 2nd period. Anomalies represent 3-month running means, plotted at the final point of each period. The anomaly series is identical to the cumulative sums of the tendency series, and the final anomaly value (+1.03 °C) represents the net SST change throughout the record.
Each of the previous warming events was followed by cooling of approximately equal magnitude within the next 6-24 months, resulting in relatively small net changes in SST and upper-ocean heat content. A notable exception to this behavior was the steep Arc SST rise of 1994-95, which introduced a ~20-year period of warm surface conditions and strong hurricane activity in the North Atlantic that remains, in some respects, to the present (a shift to the warm phase of the Atlantic multi-decadal oscillation). An opposite case is seen around 1970, when strong warming in 1969-70 was followed by a deeper SST drop in 1971-72 that marked the beginning of cool conditions and weak hurricane activity through 1994 (a shift to the cold phase of the Atlantic Multidecadal Oscillation).
The climatic implications of the current warming pulse remain to be seen. Historically, North Atlantic climate shifts have followed extreme SST changes over periods of ~12-24 months, while shorter spikes like early 2023 have been reversed by subsequent atmospheric forcings.
Why did the 2023 warming occur? Much of it can be explained by atmospheric forcing by the negative phase of the NAO, and positive SST feedbacks of the AMM. NAO- anomalies involve anomalous low pressure over most of the North Atlantic basin, weak surface westerly and trade winds, and reduced evaporative cooling that sequesters heat (mainly from solar warming) in the upper-ocean mixed layer. In the tropical North Atlantic positive SST anomalies can also promote NAO-like SLP and wind anomalies, reinforcing the initial atmospheric forcing through a positive Wind-Evaporation-SST (WES) feedback, while enhancing surface solar heating by reducing stratocumulus cloudiness and Saharan dust concentrations in the tropical atmosphere.
We diagnosed recent Atlantic SST changes by analyzing modes of atmosphere-ocean variability using gridded 3-month tendencies of atmospheric SLP and SST. The approach is similar to conventional EOF analysis, but focuses on short-term coupled variations with the atmosphere leading by one month. We identified 4 primary patterns that account for >80% of the Arc SST warming (+0.53°C) between FMA and MJJ windows in 2023.
The four influential modes are illustrated in Fig 14 as maps of SLP and SST tendencies, each overlain with related surface wind patterns. The primary mode (M1) reflects SLP and wind variations of the NAO/AMM and slightly delayed SST anomalies in the structure of the North Atlantic Arc and a well-known ‘tripole’ SST response to the NAO. This single NAO/AMM mode accounts for approximately half (+0.26°C) of the observed Arc warming in spring-summer 2023 with an MJJ peak that is comparable to several earlier warming events since 1982.
An additional source is indicated by the second mode (M2), which describes tropical surface warming, particularly off West Africa, in response to high equatorial SLP and a weak meridional SLP gradient that produces weak trade winds. This pattern persisted at moderately positive amplitudes since December 2022, and accounts for +0.10°C warming over the Arc from FMA to MJJ. This pattern typically develops from quasi-uniform increases in temperatures and geopotential heights in the tropical troposphere (15°N-15°S), as seen in early 2023 with the growth of El Niño conditions.
Another mode (M4) accounts for a coupled pattern of high SLP, anticyclonic winds and warm SSTs in the midlatitude North Atlantic off Europe, which contributed +0.08°C to the observed Arc warming. This pattern, with collocated SLP and SST anomalies, is suggestive of a positive feedback between warm surface conditions and a midlatitude blocking high. The M4 index displayed a sharp reversal from negative to positive anomalies, with a peak in MJJ.

Figure 14. Modes of coupled SLP-SST tendencies with influence on recent changes in the North Atlantic and eastern Pacific. Left column illustrates 4 modes (top to bottom) that represent patterns of SLP tendencies that precede the SST tendency patterns to the right (center column). Vectors show associated surface wind anomalies. Time series in the right column illustrate the 1982-2023 evolution of each mode. The final (highlighted) value of each series represents MJJ 2023 (MJJ changes vs. FMA). Each series is scaled to reflect its contribution to Arc SST tendencies.
We also include an ENSO-related mode (M6), which is defined by declining SLP and rising SSTs in the eastern equatorial Pacific, as wells as surface warming that extends into the subtropical North Atlantic. This mode peaked in the positive phase in MJJ, reflecting an observed SLP decline in the eastern Pacific, but accounts for little of the recent Arc SST warming (+0.01°C).
Figure 15 illustrates the FMA-MJJ SLP-SST changes described by all four modes in combination. These patterns account for major features of observed SLP change, including a drops in North Atlantic SLP and trade wind intensity, declining eastern Pacific SLP, and increasing SLP in conjunction with surface warming over western Europe. SST changes describe by the four modes provide a good match to observed changes over the North Atlantic and the tropical eastern Pacific.

Figure 15. Left: MJJ 2023 SLP and SST tendencies described by the four modes discussed in the text. Right: Observed MJJ SLP and SST tendencies.
The history of Arc SST tendencies is also well-described by the four coupled modes in combination (r = 0.91, Fig. 16), indicating the strong influence of these patterns on overall atmosphere-ocean variability in the North Atlantic.

Figure 16. Arc SST tendency anomalies (1982-2023). Blue: observed. Red: reconstruction from 4 SLP-SST modes.
This analysis shows that a small set of coupled SLP-SST modes can account for a large fraction of observed spatial and temporal variability of North Atlantic climate. The modes capture known patterns of atmospheric forcing upon SSTs, particularly the NAO and a slightly delayed Tripole response. This interpretation is supported by patterns of surface winds that match those of physical SST responses, largely through the direct effects of wind speeds on evaporation rates, and opposite responses in SSTs. For example, the NAO SLP pattern, as illustrated, reflects a cyclonic surface wind response to low SLP over the central North Atlantic, which weakens the mean anticyclonic circulation pattern, simultaneously reducing the intensities of midlatitude westerly winds and tropical-subtropical trades. Consequent reductions of evaporative cooling rates (i.e. positive downward latent heat flux anomalies) lead to warming in these areas, as reflected by the coupled SST component of the NAO mode.
Additionally, the spatial structures of the coupled modes suggest important influence of SSTs upon atmospheric circulation, largely in a reinforcing manner. All four modes display collocated SLP-SST anomalies of the same sign, wherein areas of cool midlatitude surface conditions (M1, M2, M6) coincide with areas of low pressure and cyclonic circulation, likely due to surface cooling of the overlying troposphere, a drop in geopotential heights and resulting cyclonic circulation anomaly in the mid-tropospheric westerly flow that in turn affects surface pressure and winds. Conversely, areas of warm SSTs favor tropospheric warmth, elevated geopotential heights and a blocking anticyclonic circulation aloft that tends to reinforce initial warming, as suggested by positive M4 anomalies that account for increasing SLP and SST over western Europe.
The implied positive feedbacks between SSTs and atmospheric circulation provide a reasonable explanation for the occasional development and persistence of extreme SST anomalies, as seen in the spring of 2023. Such coupling suggests a stronger SST influence on midlatitude circulation than is commonly appreciated, and we are developing predictive tools to improve seasonal forecasts of the ‘noisy’ midlatitude circulation from relatively slow-changing SSTs. Any external perturbation, say from reduced ship fuel aerosols, will project onto these modes of variability, reinforcing the M1 and M4 patterns.
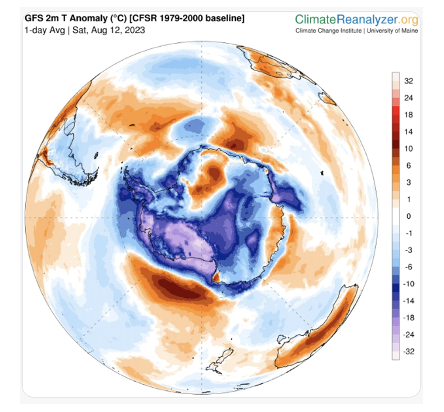
Antarctica
Antarctica has a significant cold anomaly, running 3oC below average. The lack of Antarctic sea ice is not directly caused by warming because the region is very cold.

Figure 17. Pulled from twitter
The other Antarctic anomaly of interest is the early seasonal start to formation of the Antarctic ozone hole. The Hunga-Tonga eruption is having an impact here. The addition of a large amount of stratospheric water vapor over Antarctica causes stratospheric cooling and the formation of ice clouds in the stratosphere when there is more water vapor than usual. These ice particles catalyze the reactions from the ozone-destroying chemicals.
There is concern about the impact of the ozone hole on Antarctic sea ice, which was low in 2022 as well as 2023. The mechanism is to change the circulation patterns (and winds) in the mid/high latitudes. A larger ozone hole may lead to a positive phase of a climate driver called the southern annular mode (SAM), which reflects the strength and N-S location of the belt of strong westerly winds. A shift of the winds poleward can push away more ice. However in 2023, a different wind pattern has been in play, bring strong winds from the north that are breaking up and compressing the sea ice against the continent; this is producing complex regional patterns.
Conclusions
This Report has provided an integrated look at the global climate from the perspective of the global radiation balance at the top of the atmosphere, components of the surface energy balance, and the internal modes of climate variability driven by atmospheric and oceanic circulation patterns. Recent anomalies are introduced by external forcing from the Hunga-Tonga eruption in 2022 and the change in sulfate aerosol emissions from ship fuels which started in 2015 and was mandated in 2020.
The exceptionally warm global temperature in 2023 is part of a trend of warming since 2015 that is associated primarily with greater absorption of solar radiation in the earth-atmosphere system. This increase in absorbed solar radiation is driven by a slow decline in springtime snow extent, but primary by a reduction in reflection from the atmosphere driven by reduced cloudiness and to a lesser extent a reduction in atmospheric aerosol. Any increase in the greenhouse effect from increasing CO2 (which impacts the longwave radiation budget) is lost in the noise.
El Nino and La Nina introduce strong interannual variability into the top-of-atmosphere and surface energy balances. Against this strong background of interannual variability, there is discernible evidence of the impact of the change in ship aerosols primarily in the mid latitudes of the Northern Hemisphere. The impacts of Hunga Tonga in the stratosphere are primarily expected to occur in the winter hemisphere, because of cancelling of longwave and shortwave effects in the summer hemisphere.
Global variations in the surface energy budget show anomalous shortwave heating in the mid latitude Northern Hemisphere, which is influenced by the reduction of sulfate aerosols from ship fuel. The eastern north Atlantic is warming from anomalously low turbulent heat fluxes, reflecting weak surface winds particularly in the Caribbean and Gulf of Mexico. In the mid/high latitudes of the Southern Hemisphere Oceans, there is strong cooling from surface turbulent fluxes that are associated with strong wind speeds.
In the North Atlantic, a decomposition of the modes of atmospheric circulation patterns shows a confluence of factors that are contributing to the anomalous sea surface temperatures and circulation during summer 2023. The implied positive feedbacks between SSTs and atmospheric circulation in our analysis provide a reasonable explanation for the occasional development and persistence of extreme SST anomalies, as seen in the spring of 2023.
Of direct relevance to Atlantic hurricanes, warming in the midlatitudes of the NH, with possible contribution from reduced sulfate aerosol, has given the northern branch of the AMO+ new life, which had overall been cooling since 2015.
Distorted warming in colder drier areas of the north Atlantic disturbs the vertical velocity patterns, leading to the expansion of the Hadley Cell. The Hadley Cell expansion is consistent with the Bermuda High being fairly far north this year, with intensified dry air over the subtropical oceans. This pattern may support a northward shift of tropical cyclone formation and suppression of low latitude formation.