Why climate models not yet worth their salt!
By Jim Steele
As all hurricane researchers lament, model predictions of when and where hurricanes will intensify, have not improved much in the past 20 years. As recently as the early 2010s, weather model forecasts failed to predict 88 percent of rapidly intensifying tropical storms. Nonetheless National Public Radio (NPR) has ranted that hurricanes are “intensifying more quickly, turning from less-serious storms to very strong ones in hours or days. Superheated ocean waters hold a lot of extra energy, and a growing storm can draw from that enormous pool.” But such “superheated water” is not widespread as rising CO2 narratives suggest, but found only in very limited regions and usually associated with “barrier layers”.
Hurricanes intensify as they draw “superheated” subsurface waters of 65.5°F or higher. However, when a hurricane’s suction pulls up cooler subsurface waters, the hurricane weakens. This negative feedback naturally limits the intensity of all hurricanes. In the upper panel of the attached graphic, Arnand (2023) illustrates where thin barrier layer exists, hurricane intensity hovers around Category 1. In contrast, where thick barrier layers form, cooler deep waters are prevented from reaching the surface, and instead allow superheated sub-surface waters to cause rapid intensification.
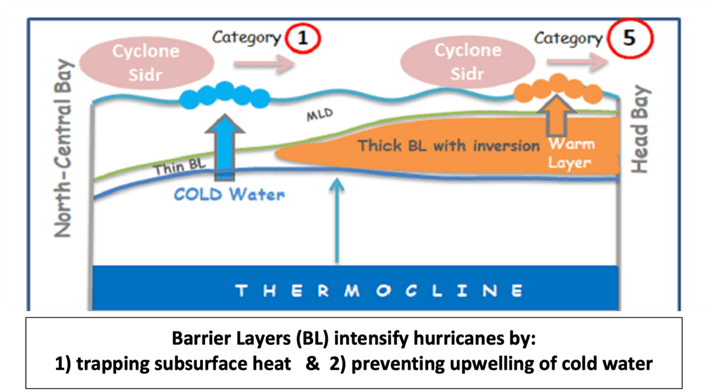
Denser fluids don’t naturally rise above less dense fluids! Barrier layer formation happens wherever freshwater overlays dense salty waters. Although solar heating would normally make subsurface waters less dense and rise to the surface, layers with higher saltiness makes the water more dense which inhibits warm convection. That traps and intensifies the subsurface heat, enabling hurricanes to intensify to Category 5.
As illustrated, solar ponds can produce useful heat and electrical generation by simply maintaining a dense salty layer at about a 10-foot depth and overlay it with a fresh upper surface layer. As illustrated in the left-hand graphic, despite ambient air temperatures of only 30°C, solar pond’s dense salty layer reaches 90°C. ( For more details regards solar ponds dynamics, watch Science of Solar Ponds Challenges the Climate Crisis )
Similar to solar pond dynamics, the right graphic of the middle panel documents a natural forming barrier layer in the Bay of Bengal, where subsurface temperatures that would normally be cooler than the surface were “superheated” to 4.5°C warmer than the surface layer. In the Bay of Bengal thick barrier layers often form and intensify cyclones due to freshwater flows from the Ganges and Brahmaputra Rivers overlaying dense salty water. Likewise, thick barrier layers are common in the south China Sea due to freshwater outflow from the Yangtze River (Chángjiāng). Barrier layers form in the Caribbean due to outflows from the Amazon and Orinoco Rivers, while outflows from the Mississippi River cause barrier layers in the Gulf of Mexico.
Intensification does not require higher ocean heat content. Climate models fail to accurately predict hurricane intensification because the models rely on sea surface temperatures and ocean heat content, but lack good subsurface saltiness data to determine barrier layer dynamics. Miles (2023) studying the intensification of Hurricane Ida in 2021 concluded that even with marginal ocean heat content, barrier layers are conducive to storm intensification. By not including barrier layer dynamics, climate model predictions have suffered high failure rates yet still incorrectly attribute hurricane intensification to rising CO2.
Hurricane Katrina was one of the worst natural disasters in US history causing over 1800 deaths and billions of dollars of damage. New Orleans was susceptible to heavy hurricane-induced flooding because humans dried out the land causing the city to sink, while the government failed to maintain the required levees. Although Katrina was only a Category 3 when it struck New Orleans it is often described as a Category 5. Thus, the tragedy of Katrina prompted a flurry of research on extreme weather attribution and proclamations of a climate crisis. But the bottom panel of the attached graphic shows Katrina only intensified to a Category 5 for a brief time in a limited area, consistent with barrier layer formation.
The Gulf of Mexico’s summer surface temperature hovers between 28 to 29°C as the Loop Current delivers warm and salty tropical water. As that current pushes closer to the Gulf Coast and gets covered by fresh Mississippi water, barrier layers form. As Katrina’s storm track reveals, it was a weak Category 1 off the coast of southern Florida suggesting a lack of any “superheated” water that alarmist suggest rising CO2 is causing. Then over a 24-hour period Katrina intensified from a Category 3 to a Category 5, then weakened back to a Category 3, again consistent with barrier layer dynamics.
The fact that extreme Category 5 hurricanes are clustered over a few years, and then disappear for another 5 to 8 years, suggests the variability in dense salty currents and freshwater outflows, will cause variable formation of thick barrier layers. But the media rarely ever educates the public about barrier layers. Likely because barrier layers provide an alternative scientific warming dynamic that conflicts with the CO2 crisis narratives.
You can always recognize biased alarmist scientists and media. They will report the intensification of a hurricane in a very small region for a very short time where barrier layers form, and only blame it on CO2global warming.