by Chris Morris
New Zealand (NZ) offers a good example of operating an electricity grid with relatively high penetration of renewables, almost exclusively wind.
This is a companion post to the ones previously done on the Australian (AUS) grid: Australian Renewables Integration: Part 1, Part 2, Part 3. and the recent update. The New Zealand gird has is a very similar market structure but with significantly different generation base. However, the same type of issues from moving away from fossil fuels to renewables are occurring.
Overview
The NZ grid runs on a market model, similar to but simpler than that of AUS. The Market regulator is the Electricity Authority (EA) — the NZ equivalent of Australian Energy Regulator. The grid owner is Transpower and the day-to-day wholesale market is under the control of an arm’s length subsidiary, System Operator.
The transmission grid is effectively a spine running the length of each island with spurs out to large generators or load centres. There is a relatively high capacity DC link between the two islands. The grid is usually run as a single market entity, with generation and reserves shared between both islands. Figure 1 shows a simplified map.
 .
.
Fig 1 A simplified version of the grid map – the largest dots are about 1300MW and the smallest 200MW
The NZ market, unlike AUS, does not have negative pricing. Instead, must-run bids are put in at 1c/MWh. Most of the time, there is little price separation between the two islands, but in general prices rise as one moves from south to north. This is the way power usually flows. Live generation and market data is shown here and here. The prices are shown in 14 regions, to reflect the role of line constraints in pricing. About two thirds of NZ’s load is in the North Island, and two thirds of that is in the upper half.
The big difference with AUS is that NZ generation is hydro dominated, with thermal plant typically making up only 10-20% of the supply. The total generation is about 44TWh a year (AUS is over 270TWh), of which hydro is about 60%. However, this varies year to year depending on rainfall. Geothermal provides 20%. Wind is less than 10% and solar insignificant. With the different climate to Australia, solar in NZ has a lot less potential. Average sunshine hours across the country are about half of outback Australia’s. One of the original settlers’ names for the country translates as “Land of the Long White Cloud”.
Because of the temperate climate, air conditioning and heat pumps (large daytime electricity loads) aren’t common. The gas fired stations typically provide about two thirds of the difference between renewables generation and load, with coal supplying the remaining third. Generation from diesel fuelled gas turbines (GTs) is only for the very high peaks and emergencies. Figure 2 shows the generation source – the major “Other” contributor is from wood waste boilers driving steam turbines.

Fig 2 Annual Generation by source. The hydro and wind contributions are more variable over shorter time periods, even just quarterly. There have been no significant hydro developments since the early 90s.
The 1GW of geothermal runs in the same niche that nukes occupy – baseload at very high load factors, typically >90%. The hydro is based on three main rivers and an underground station connecting a big lake directly to the sea. There is relatively little hydro storage (about six weeks supply when the head lakes are all full), but the country typically has year-round rain with snow-melt in spring. If it doesn’t rain for a month or so, more coal is burnt. The hydro and geothermal generating units are smaller than the usual thermal equivalents. Almost all hydro generator units are less than 110MW, with most in 30-50MW range. That makes it easier to match generation to available flow.
Unlike Australia, the NZ load is highest in winter. Daily electricity usage is about 100GWh in summer and 120GWh in winter, with the near nation-wide shut down during the end of December early January summer holidays, dropping it down to less than 90GWh. Typically, the annual peak load is about 7GW just after dusk in the middle of winter – a calm frosty night. When this occurs, there is typically an anticyclone over the whole country.
The daily load curve has a pronounced double peaked shape. This 40% change makes it quite different to many other grids including AUS, which often have large heavy industry demand as part of their load. Figure 3 shows the maximum and minimum over a recent two-year period. The evening peak is generally higher; but in winter, it can be the morning one. The only big industrial load is a 500MW smelter at the bottom of the South Island which both stabilises the grid and offers rapid short-term demand response if the hydro which mainly supplies it has a unit trip. There is another about 200MW of near continuous demand in big industries, mainly pulp and paper mills, but these often have embedded generation to deal with their waste products and lower their grid demand.

Fig 3 all the daily NZ grid load in 2017-18 was between the two lines. The orange Xmas Day was the minimum by some margin with the wrinkles at 5:30 and 20:30 being sunrise/ sunset. The shape of the curve throughout the year is markedly consistent with the big ramp- up 5am to 8am and the double peaks. That big 2500MW ramp-up is mainly done with hydros but almost always does need significant thermal input. Power stations that run mainly in the heavy load period 0600 to 2200 are said to be two-shifting.
With geothermal’s 1GW at the bottom of the generation merit order stack, the minimum load is made up by must-run thermal & hydro, plus what wind there is. Like AUS, the wind is unreliable – if anything, worse. Wind has a higher nameplate rating available than geothermal, but wind provides only 40% of the geothermal energy. The windfarms are located across length of the country north- south line (and the main wind comes from the west quadrant), but are concentrated in the lower North Island where the wind is strongest. Total wind farm output can vary from 900MW down to 6MW! Despite the distances, there is significant synchronicity in the windfarms’ generation. The swinging up and downs of total wind supply rarely match grid requirements. The variability has caused short-term operational problems in frequency and voltage management as well as ramp up problems. At the 3-4 am minimum load period, wind may make up a quarter of the supply.
Chains of hydro stations dam the steeper parts of rivers to use all the head available, with one station’s tailrace at the head of the next hydro lake. They start and stop multiple generators in synch at each station, rather than changing the individual machine’s outputs to match the load. Water needs to be staged during low demand periods to supply the lower dams and to avoid dewatering downstream riverbeds. Figure 4 shows both this loading and the value of dispatchable generation. Hydro spill is minimised as the EA can fine generation companies for not using water to generate, which could raise the market prices. Other than the big floods, or units being out of service on maintenance, the only spill happens just when there is too much generation available for the load and the hydro stations are dispatched off.

Fig 4 – Load following by the 3 main hydro rivers. Each river has a different company operating the stations on it. The two low sets of curves on the graph’s right-hand-side are the weekend. This operational pattern is often called two-shifting. The notchiness in the purple line is caused by the big size of the units – full load or off operation.
To help minimize the impacts of rapid load rises, the distribution companies have a system where customers can have short-term non-essential power like hot water and space heaters available to be switched off when required. They are on separate meters and get the power at a cheaper rate (for me, it is about 4c/ unit) The switching is done by injecting high frequencies into the 50Hz waveform which triggers relay switches. The common name for this is ripple control. Across NZ, a nominal 1GW is available, but the typical load on it at any one time is only 100-150MW.
The market price for power is typically around $120/MWh. However, lately as more windfarms come in, the distribution curve of market prices has become bimodal, <$30 when lakes are full and the wind is blowing, >$200 when it isn’t. The merit order stack can be very steep. One thing that needs to be stated clearly (as many don’t understand it) is the market is only for residuals – maybe 10% of the total generation. Most of the retailers have long-term pricing contracts or hedges to cover their customer’s electricity loads. In contrast to Australia, NZ’s domestic power prices have remained remarkably steady over last fifteen years; in fact, slightly dropping since 2015 as shown in Figure 5 NZ power is now cheaper than AUS and less likely to rise as fast.

Fig 5 Inflation adjusted domestic power prices.
For those that don’t understand how market dispatch works, the day is divided up into 48 ½h segments – Australia is now 5-minute segments. The generators put in their bids of MW and cost (in terms of $/MWh). These bids are arranged in ascending price order (bottom of stack are must run units at $0.01 cost). The lowest price ones up to the demand are the ones to be dispatched to generate. Spot market price is set by the unit cost of the last unit dispatched. Another name for this is merit order. If there are constraints, like transmission line outages, then these can reshuffle the merit order. If there is too much generation at even minimum price, the ones least needed for security are dispatched off. This means the grid tells the plant to stop generating or maybe just reduce output.
There are two main parts to what companies set as their bid packages (MW & price) to recover their costs – the fixed and variable components. The fixed charges are recovery of the cost of that power station, divided by number of hours it is expected to run. This would include staff & contractors, overhauls, and recovery of the capital costs of building and refurbishing the plant. For thermal plant, the variable costs would mainly be for fuel which includes the carbon charges. This might not be a fixed sum as efficiency varies with load and starting up requirements that don’t generate income can use a lot of fuel. Stop/ Start operation increases maintenance and capital costs. For a hydro plant, the variable charge is the value of that water, at least if they have storage capability. Use it now, or save it? Factors that influence the price is how full all the hydro lakes are, and the longer-range weather forecast. There is also the risk to be factored in of having to buy the power from thermal plants if there isn’t enough water to supply their customers’ load requirements. What this can mean is that some hydros split their bid. Some “must run”, some at a cheap price and some more expensive than coal.
Thermal makes up the difference between available renewables generation offered in on the merit order bids and the actual load. As hydro storage drops or the wind dies, thermal increases its contribution. It also acts as dry period reserve. The level of the lakes is a very important metric major consumers monitor. Most of the hydro is in the South Island and all the thermal in the North. It is not unusual for the DC to run lightly south at night and heavily north during the day. This may not be the situation for much longer. The major thermal plants are getting old and the government wants them to shut down. Replacement alternative dispatchable power supplies aren’t being built. For the foreseeable future, the grid won’t be secure for both the power and energy requirements without the reserve provided by maintaining the coal and gas fired plants so they can generate when needed.
Transpower does a good planning process, putting out an Asset Management Plan and a transmission planning report every two years. The latter document breaks the country down into regions, looking at the expected load change for every grid exit and injection point as well as switchyards. They then use these documents to prioritise their capital works programme. It then goes to the EA to get authority to increase charges to pay for it. The reports aren’t definitive as they were recently caught out by a major cyclone flooding incident which took out two big switchyards, needing major remedial work and capital expenditure. The major problem the process has is the grid company is wholly owned by the government, which prefers dividends to asset building.
As the grid is relatively small, frequency swings can be often and significant. Frequency control is done by a number of methods. It can be through very short dispatch period adjustments – 20MW up or down type instructions. Or it can be by running some units partially loaded on governor control. However, it can still be tricky to manage without the buffer of the resources of a larger grid. Frequency swings are larger because of this. In NZ, a 1Hz swing isn’t uncommon while AUS rarely goes worse than 0.2Hz. This is a problem of small grids, especially those without relatively large stable industrial loads like smelters.
Figure 6 shows the normal ramp up in the spring early morning. Figure 7 shows the effect of the final of the Rugby World Cup held in England the following weekend which many New Zealanders would have got up about 4:30am to watch. The rapid 400MW load increase at half-time caught the SO out. The frequency drop that went with the 10% rise needed major corrective action.

Fig 6 A typical Sunday morning load ramp-up

Fig 7 2015 Rugby World Cup and effect of half-time. Frequency dropped to about 48.5Hz until ripple control and reserves brought it back under control.
The grid inertia requirements are generally not seen as an issue because of all the hydro and geothermal units running. Most reserves (also part of the market) are managed by either partially loaded, or in-service as synchronous condensers, hydro units. The latter are connected to the grid, but have the inlets shut and use compressed air to depress the water in the tailrace. This allows the runner to spin in air with relatively little power consumption. Units in this mode can then be used to give voltage support. They can also open the inlet controls and be up to full load in 10-15 seconds – instantaneous reserve. GTs provide slower acting support.
There are problems controlling transmission line voltages into NZ’s biggest city, Auckland, because there are no nearby synchronous generators. The nearest one is at Huntly, a large thermal station complex 60 miles to the south. Even with that, stations in the centre of the North Island have to provide significant voltage support. That shortcoming needs major switchyard investments to correct. The DC link and windfarms are also prone to cause sub-synchronous oscillations in the grid which will eventually need correction, but have not significantly manifested themselves yet.
There was some load shedding in an event two winters ago, when wind generation dropped in the afternoon, too late to bring on slow start thermals for cover. Then they had weed blocking the intake screens at a big hydro, limiting their output; but the main problem was the SO’s grid management model and processes were wrong. They could have just made it through on the generation they had. Much mea culpa about that incident with a lot of revision and validation work done. It is not supposed to happen again.
More big dams are politically unpalatable so there is little hydro development potential. Growth has been accompanied by a gradual move to build more geothermal and wind. However, there are few new sites for geothermal left to develop. Geothermals are also being installed for the two shift operation. To balance this, there is retirement or less operating for the big thermals. The major problem will come when there is not enough thermal to cover the shortfall when there’s little wind and not enough water for hydros. This will especially challenging for the daily ramp up, as well as when covering the unexpected cold day peaks with sufficient reserves. Even now, it is not unusual to have more than 1500MW of reliable thermal plant running to make up the difference between what renewables generate versus the load.
The income derived from thermal plants has to meet their fixed as well as operating costs, so with lowered participation they become uneconomic and will eventually be forced to close. Even a major breakdown could be uneconomic to fix. The government in another virtue signalling move severely restricted gas exploration and development. This will mean future fuel supply is uncertain. The one coal station is old, though not as old as many in AUS. Coal is imported from Indonesia though the station sits on a coalfield. Transmission line problems and lack of reserves can exacerbate the generation shortage situation. That shortfall leading to rolling blackouts may be only a calm dry, cold winter’s day away.
There is no overall co-ordination of power station development. It is left to each generation entity (four big power companies, two smaller ones, as well as overseas developers or community groups) to evaluate potential new plant on its own merits; looking at the market, their balance sheets and customer load profiles. They then apply for consents to build and operate it. Stations won’t be built unless the owners believe they can pay back their capital and operating costs. This has frustrated many who yearn for a return to the days of centralised planning largesse. Invariably, those decisions were driven by political, not grid management or financial reasons.
Because the current government wants to virtue signal, moving from the predicted 95% renewables by 2030 to 100% while also providing cover as dry year reserve, development of a massive pumped storage scheme at Onslow in the lower South Island has been promoted. Exact details aren’t forthcoming as it is still just a concept, but it is scoped as about 1200MW, 5000GWh. Pricing just for the station went from $4B to $16B in the space of two years of investigation, but the Minister of Energy still thinks it is a good deal. Industry speculation is that the real capital cost of all the infrastructure needed would maybe double that. There is no report or details as to how it will operate or integrate into the market trying to pay its way by arbitrage. It has been discussed as both dry year storage or day to day energy smoothing – it can’t do both. There will need to be massive transmission lines and switchyard infrastructure built to utilise the power if it goes ahead. As well, many windfarms will need to be built to fill the lake. None of these have been proposed, let alone costed. If the government changes at the forthcoming election, the current Opposition have stated they will kill the project. Consignment to the never-to-be-mentioned-again graveyard of politicians’ bad ideas then is inevitable.
There are a lot of plans to build more wind and grid solar farms, but many see them as just tyre-kicking exercises, with few consents applied for and even less construction starting. The windfarms get no direct subsidies from NZ consumers. Therefore, the economics just aren’t there for building additional plants of this sort. They do get an indirect subsidy, in that they don’t have to meet dispatch where other generators can get fined if they don’t keep their output within pre-notified tight limits. Domestic solar has various subsidies to help assist installation but these aren’t generous. There are no government feed-in-tariffs (FITs) for their output, though some distribution companies offer a nett power (single meter) option.
Almost all generation from existing windfarms is purchased by the large generation companies (if they don’t already own them), who then offset the output against their other generating assets. However, that margin for balancing is now near gone, especially with thermals closing down. The NZ market will need modifications to accommodate the variability. This is especially so with reserves management.
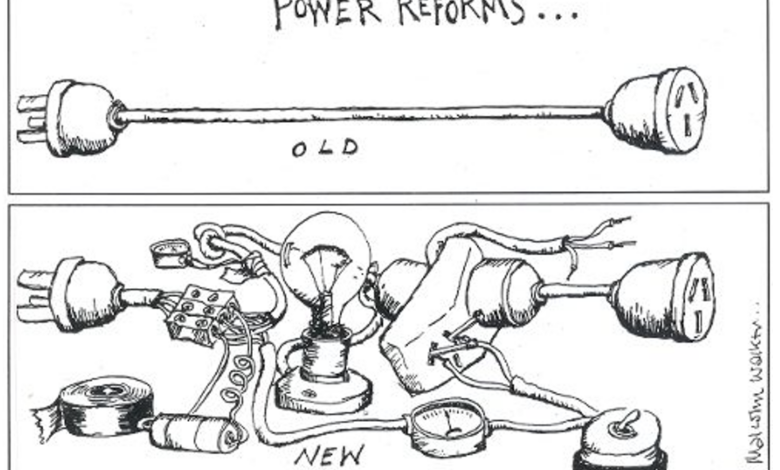
Though it was near thirty years ago, one paper’s cartoonist got it right about creating a complex market.

For the reasons outlined above, it is more likely that Australia will have operational problems maintaining its grid before New Zealand does. However, the latter is not immune from the same issues confronting other Western countries. It will be interesting to see which government will be the first to publicly say the heresy that net-zero power generation won’t work.