by Nicola Scafetta
Outcome of an exchange of Comments at Geophysical Research Letters (GRL) on my paper regarding ECS of CMIP6 climate models
Back in March 2022 Gavin Schmidt on RealClimate.org critiqued one of my papers:
- Scafetta, N., Advanced testing of low, medium, and high ECS CMIP6 GCM simulations versus ERA5-T2m, Geophysical Research Letters, 49, e2022GL097716, 2022, https://doi.org/10.1029/2022GL097716.
My GRL paper compared the warming of the global surface temperature data from 1980–1990 to 2011–2021 against the CMIP6 GCM hindcasts and found that only the GCM macro-ensemble made with the models with an Equilibrium Climate Sensitivity (ECS) ≤ 3 °C well agrees with the global surface temperature observations. The result is rather important because the GCMs with a low ECS are also those that project a moderate and nonalarming warming for the 21st century, in particular when the SSP2-4.5 scenario, which is the only SSP that seems to be realistic, is used for the climate projections.
Schmidt disliked my paper and claimed that it contains “numerous conceptual and statistical errors that undermine all of the conclusions”. Together with Gareth Jones and John Kennedy, he wrote a letter to the Editorial Board of GRL asking them to retract my paper. They claimed that (1) my GRL 2022 paper overlooked the error of the mean of the temperature data from 2011 to 2021, which they claimed to be 0.10 °C, and (2) they insisted that “the full ensemble for each model must be used” to test the models.
Their retraction request was rejected. GRL decided that a Comment-Reply exchange was more appropriate to clarify the subtle statistical issues that were being raised by their critiques and my rebuttals. Thus, Schmidt, Jones and Kennedy submitted their formal Comment, which essentially repeated the claims previously published on Real Climate. After their Comment was accepted on the 28th of January 2023, GRL asked me to write a formal Reply, which I submitted on the 21st of February 2023. My Reply was accepted on the 22nd of July 2023 and, finally, on the 21st of September both papers were published by GRL:
- Schmidt, G.A., Jones, G.S., & Kennedy, J.J. (2023). Comment on “Advanced testing of low, medium, and high ECS CMIP6 GCM simulations versus ERA5-T2m” by N. Scafetta (2022). Geophysical Research Letters, 50, e2022GL102530. https://doi.org/10.1029/2022GL102530
- Scafetta, N. (2023). Reply to “Comment on ‘Advanced testing of low, medium, and high ECS CMIP6 GCM simulations versus ERA5-T2m’ by N. Scafetta (2022)” by Schmidt et al. (2023). Geophysical Research Letters, 50, e2023GL104960. https://doi.org/10.1029/2023GL104960
My Reply demonstrates that Schmidt et al. made gross statistical and physical errors and that, in any case, their critiques do not change the conclusions of my 2022 GRL paper.
The Plain Language Summary of my Reply reads:
Schmidt, Jones, and Kennedy’s (SJK) (2023, GRL, link) assessment of the error of the ERA-T2m 2011–2021 mean (σμ,95% = 0.10 °C) incorrectly assumes that, during such a period, the global surface temperature was constant (T
Both publications are open access, so interested readers can judge the scientific merits of both points of view for themselves. See also Schmidt’s latest post at RealClimate [link].
I found the Comment by Schmidt, Jones and Kennedy to be outdated and paradoxical because their main arguments had already been fully rebutted in another and much more extended paper of mine (Scafetta, N., CMIP6 GCM ensemble members versus global surface temperatures, Climate Dynamics 60, 3091–3120, 2023, [link], which they did not even cite. They also ignored other works (e.g. Lewis, N., Objectively combining climate sensitivity evidence, Climate Dynamics 60, 3139–3165, 2023 [link], first published on 18 September 2022) which essentially confirmed my main result that the actual ECS had to be ≤ 3 °C. The same result is now also confirmed by a third work (Spencer, R.W., Christy, J.R., Effective climate sensitivity distributions from a 1D model of global ocean and land temperature trends, 1970–2021, Theoretical and Applied Climatology, 2023 [link]. My GRL Reply performs the calculations using the same data as in my GRL 2022 study, also considering Schmidt et al.’s main critiques outlined above, and once again validates the original finding in my 2022 GRL paper.
Herein, I would like to address only a major statistical and simple topic discussed in my Reply that might be of general interest: how to calculate the error of the mean of a temperature record.
The issue was to determine the error of the mean of the global surface temperature record from 2011 to 2021, that is an 11-year period. Schmidt, Jones, and Kennedy claimed that such an error must be calculated with an equation known as the Standard Deviation of the Mean (SDOM) and adopted the following equation:

where T i are the N = 11 annual temperature values from 2011 to 2021 and

is the mean over the 11-year period. As a result, they stated that the global surface temperature records from 2011 to 2021 are affected by a mean error of 0.10 °C.
However, such a result is clearly incorrect because the decadal uncertainty associated with the global surface temperature record from 2011 to 2021 (or even since 1980) has never been calculated to be 0.10 °C in scientific literature. Even on an annual scale, the global surface temperature data error has been reported to be much smaller than 0.10 °C, as also GISTEM (authored by Schmidt) and HadCRUT (authored by Kennedy) clearly show. For example, the Berkeley Earth’s global surface temperature record [link] reports a decadal scale error of about 0.02 °C (I reported the data version published in April 2023). Moreover, the claimed 0.10°C error is arbitrary calculated because Eq. 1 with the monthly temperature record (which has N = 132) yields an error of about 0.03 °C. As a result, utilizing the SDOM makes no sense because by simply interpolating the data and raising N, one may obtain an error as small as desired.
In fact, Schmidt, Jones, and Kennedy did not realize that, in our specific case, Eq. 2 is not the mean of a distribution of N repeated random measurements of one quantity, but a function of N different quantities. The 11 annual mean temperature data used for evaluating the mean from 2011 to 2021 are not 11 stochastic estimates of their 11-year mean and, therefore, they do not form a distribution of stochastic measurements of one quantity. When one just has a function of N different quantities, its error cannot be computed with the SDOM but only with a different equation known as the Gaussian Error Propagation Formula (GEPF) of a function of several quantities. In the case of the function called “mean”, the GEPF establishes that its error is given by the equation

where σzi2 is the variance of the single measurements zi, that is the reported experimental error of zi, and σzi,zj is the covariance of the individual measurement errors. When Eq. 3 is applied to the global surface temperature data from 2011 to 2021, it yields an error that varies between 0.01 and 0.02 °C according to whether the covariance of the errors is used or not.
The difference between the SDOM and the GEPF is covered in any 101 course of Statistics and Error Analysis in Physics and are detailed in popular textbooks (e.g. see Chapter 3 and Chapter 4 in Taylor, J.R., An Introduction to Error Analysis: The Study of Uncertainties in Physical Measurements (second edition), University Science Books, 1997; see also Chapter 4 and 5 in Evaluation of measurement data — Guide to the expression of uncertainty in measurement, JCGM 100:2008. [link]
In a nutshell, the GEPF must be used to assess the error of the mean weight between Mary and John (two different quantities) when using the same scale; the SDOM must be used to estimate the error of the weight of John (one quantity) when using two measurements from two separate scales. For example, every child knows that the mean between 10 and 20 (two different quantities) is 15. However, the SDOM adopted by Schmidt, Jones and Kennedy (Eq. 1) calculates 15±5 even when 10 and 20 indicate two different quantities and are error-free, which is clearly wrong because, for example, 11 or 17 are not be the mean of 10 and 20. The SDOM can be used only if 10 and 20 are two stochastic measures of the same thing of which one would like to estimate the best estimate.
Even more paradoxically, the erroneous adoption of the SDOM physically implies that Schmidt, Jones, and Kennedy assumed that the climate temperature of the Earth from 2011 to 2021 was constant, and that natural fluctuations such as ENSO and (natural and anthropogenic) trends are just errors of measure. To justify such a claim, Schmidt, Jones, and Kennedy even invented a new concept in climatology, the concept of “random nature” (perhaps derived from a parallel universe theory?). However, their interpretation of the temperature data is clearly nonphysical. Natural variability does not contribute to the error of measure of the data, but at most only to the error of a model regression coefficient of the data. However, here the issue was not to test an isothermal climate model of the type T
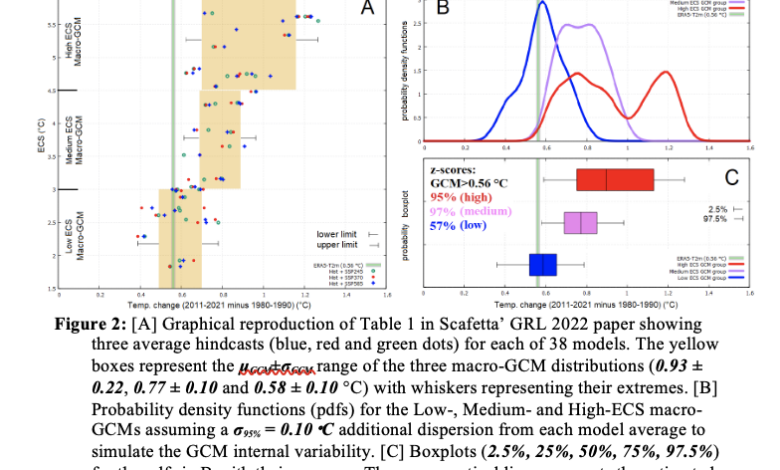
Then, Schmidt, Jones and Kennedy used their erroneous and inflated 0.10 °C error of the mean of the global surface temperature record from 2011 to 2021 to qualitatively claim that the conclusion of my GRL 2022 paper was wrong just because a very few GCM member simulations obtained with a very few GCM models with an ECS > 3 °C agree with the data within such erroneous interval, as Figure 1a shows. However, their own figure clearly shows that all the GCMs with ECS > 3 °C produce hindcasts that are statistically skewed toward temperature values larger than the warming reported by the data: see the green dots indicating the GCM average simulations. Thus, statistically speaking, such models run too hot. In fact, as my Figure 2 shows, when the right error of the mean is considered and the climate models are ensembled into three macro-GCM indicating the three ECS ranges (1.5–3.0 °C; 3.0–4.5 °C; and 4.5–6.0 °C) as did in my 2022 GRL paper and the proper statistics is evaluated also assuming some statistical dispersion due to their internal variability, the warm bias of the GCM groups with an ECS > 3.0 becomes evident. My figures are reported below.
In conclusion, the Comment by Schmidt, Jones, and Kennedy is flawed, both statistically and physically. Its publication, together with my Reply, is important only because pointing out such errors is also useful for educational purposes.
I need to add that this is not the first time that Schmidt has critiqued one of my works using severely flawed mathematics and logic. Some readers may remember that in 2009 Benestad and Schmidt published a paper in JGR (Benestad, R.E., and G.A. Schmidt, Solar trends and global warming, J. Geophys. Res. 114, D14101, 2009, [link], which was actually a kind of comment on some of my works. Here Schmidt made severe and naïve errors in the wavelet analysis and multilinear regression model, as I first demonstrated here [link]. Such errors obscured the empirically evident and significant solar contribution to climate change and might have misled the scientific community on this topic. For the interested readers, the detailed rebuttal of Benestad and Schmidt’s paper was later published here: Scafetta, N., Discussion on common errors in analyzing sea level accelerations, solar trends and global warming, Pattern Recognition in Physics 1, 37–57 [link]. Schmidt recently wrote other Real Climate flawed articles that critique papers that I have coauthored with Dr. Connolly, Dr. Soon, and many other colleagues which show the possibility that the sun can significantly contribute to climate change of the last century. The rebuttals of his critiques are found on [link].
In conclusion, these are cases that clearly demonstrate the necessity of having formal Comments and Replies published together to let the readers to properly evaluate both viewpoints. Thus, I am surprised that on RealClimate, Schmidt appears to complain that his Comment was not published by alone, before or even without my Reply. However, it is critical that professionally written Comments and Replies are published concurrently. Furthermore, for the sake of science, any form of political manipulation of journals behind the scenes (as the ClimateGate emails revealed link) must be abhorred. This must be done mostly for ethical reasons, notably to avoid potentially occurring instances of scientific disinformation campaigns promoted by the authors of the Comments and by various activist scientists.
by Nicola Scafetta
Outcome of an exchange of Comments at Geophysical Research Letters (GRL) on my paper regarding ECS of CMIP6 climate models
Back in March 2022 Gavin Schmidt on RealClimate.org critiqued one of my papers:
- Scafetta, N., Advanced testing of low, medium, and high ECS CMIP6 GCM simulations versus ERA5-T2m, Geophysical Research Letters, 49, e2022GL097716, 2022, https://doi.org/10.1029/2022GL097716.
My GRL paper compared the warming of the global surface temperature data from 1980–1990 to 2011–2021 against the CMIP6 GCM hindcasts and found that only the GCM macro-ensemble made with the models with an Equilibrium Climate Sensitivity (ECS) ≤ 3 °C well agrees with the global surface temperature observations. The result is rather important because the GCMs with a low ECS are also those that project a moderate and nonalarming warming for the 21st century, in particular when the SSP2-4.5 scenario, which is the only SSP that seems to be realistic, is used for the climate projections.
Schmidt disliked my paper and claimed that it contains “numerous conceptual and statistical errors that undermine all of the conclusions”. Together with Gareth Jones and John Kennedy, he wrote a letter to the Editorial Board of GRL asking them to retract my paper. They claimed that (1) my GRL 2022 paper overlooked the error of the mean of the temperature data from 2011 to 2021, which they claimed to be 0.10 °C, and (2) they insisted that “the full ensemble for each model must be used” to test the models.
Their retraction request was rejected. GRL decided that a Comment-Reply exchange was more appropriate to clarify the subtle statistical issues that were being raised by their critiques and my rebuttals. Thus, Schmidt, Jones and Kennedy submitted their formal Comment, which essentially repeated the claims previously published on Real Climate. After their Comment was accepted on the 28th of January 2023, GRL asked me to write a formal Reply, which I submitted on the 21st of February 2023. My Reply was accepted on the 22nd of July 2023 and, finally, on the 21st of September both papers were published by GRL:
- Schmidt, G.A., Jones, G.S., & Kennedy, J.J. (2023). Comment on “Advanced testing of low, medium, and high ECS CMIP6 GCM simulations versus ERA5-T2m” by N. Scafetta (2022). Geophysical Research Letters, 50, e2022GL102530. https://doi.org/10.1029/2022GL102530
- Scafetta, N. (2023). Reply to “Comment on ‘Advanced testing of low, medium, and high ECS CMIP6 GCM simulations versus ERA5-T2m’ by N. Scafetta (2022)” by Schmidt et al. (2023). Geophysical Research Letters, 50, e2023GL104960. https://doi.org/10.1029/2023GL104960
My Reply demonstrates that Schmidt et al. made gross statistical and physical errors and that, in any case, their critiques do not change the conclusions of my 2022 GRL paper.
The Plain Language Summary of my Reply reads:
Schmidt, Jones, and Kennedy’s (SJK) (2023, GRL, link) assessment of the error of the ERA-T2m 2011–2021 mean (σμ,95% = 0.10 °C) incorrectly assumes that, during such a period, the global surface temperature was constant (T
Both publications are open access, so interested readers can judge the scientific merits of both points of view for themselves. See also Schmidt’s latest post at RealClimate [link].
I found the Comment by Schmidt, Jones and Kennedy to be outdated and paradoxical because their main arguments had already been fully rebutted in another and much more extended paper of mine (Scafetta, N., CMIP6 GCM ensemble members versus global surface temperatures, Climate Dynamics 60, 3091–3120, 2023, [link], which they did not even cite. They also ignored other works (e.g. Lewis, N., Objectively combining climate sensitivity evidence, Climate Dynamics 60, 3139–3165, 2023 [link], first published on 18 September 2022) which essentially confirmed my main result that the actual ECS had to be ≤ 3 °C. The same result is now also confirmed by a third work (Spencer, R.W., Christy, J.R., Effective climate sensitivity distributions from a 1D model of global ocean and land temperature trends, 1970–2021, Theoretical and Applied Climatology, 2023 [link]. My GRL Reply performs the calculations using the same data as in my GRL 2022 study, also considering Schmidt et al.’s main critiques outlined above, and once again validates the original finding in my 2022 GRL paper.
Herein, I would like to address only a major statistical and simple topic discussed in my Reply that might be of general interest: how to calculate the error of the mean of a temperature record.
The issue was to determine the error of the mean of the global surface temperature record from 2011 to 2021, that is an 11-year period. Schmidt, Jones, and Kennedy claimed that such an error must be calculated with an equation known as the Standard Deviation of the Mean (SDOM) and adopted the following equation:
where T i are the N = 11 annual temperature values from 2011 to 2021 and
is the mean over the 11-year period. As a result, they stated that the global surface temperature records from 2011 to 2021 are affected by a mean error of 0.10 °C.
However, such a result is clearly incorrect because the decadal uncertainty associated with the global surface temperature record from 2011 to 2021 (or even since 1980) has never been calculated to be 0.10 °C in scientific literature. Even on an annual scale, the global surface temperature data error has been reported to be much smaller than 0.10 °C, as also GISTEM (authored by Schmidt) and HadCRUT (authored by Kennedy) clearly show. For example, the Berkeley Earth’s global surface temperature record [link] reports a decadal scale error of about 0.02 °C (I reported the data version published in April 2023). Moreover, the claimed 0.10°C error is arbitrary calculated because Eq. 1 with the monthly temperature record (which has N = 132) yields an error of about 0.03 °C. As a result, utilizing the SDOM makes no sense because by simply interpolating the data and raising N, one may obtain an error as small as desired.
In fact, Schmidt, Jones, and Kennedy did not realize that, in our specific case, Eq. 2 is not the mean of a distribution of N repeated random measurements of one quantity, but a function of N different quantities. The 11 annual mean temperature data used for evaluating the mean from 2011 to 2021 are not 11 stochastic estimates of their 11-year mean and, therefore, they do not form a distribution of stochastic measurements of one quantity. When one just has a function of N different quantities, its error cannot be computed with the SDOM but only with a different equation known as the Gaussian Error Propagation Formula (GEPF) of a function of several quantities. In the case of the function called “mean”, the GEPF establishes that its error is given by the equation
where σzi2 is the variance of the single measurements zi, that is the reported experimental error of zi, and σzi,zj is the covariance of the individual measurement errors. When Eq. 3 is applied to the global surface temperature data from 2011 to 2021, it yields an error that varies between 0.01 and 0.02 °C according to whether the covariance of the errors is used or not.
The difference between the SDOM and the GEPF is covered in any 101 course of Statistics and Error Analysis in Physics and are detailed in popular textbooks (e.g. see Chapter 3 and Chapter 4 in Taylor, J.R., An Introduction to Error Analysis: The Study of Uncertainties in Physical Measurements (second edition), University Science Books, 1997; see also Chapter 4 and 5 in Evaluation of measurement data — Guide to the expression of uncertainty in measurement, JCGM 100:2008. [link]
In a nutshell, the GEPF must be used to assess the error of the mean weight between Mary and John (two different quantities) when using the same scale; the SDOM must be used to estimate the error of the weight of John (one quantity) when using two measurements from two separate scales. For example, every child knows that the mean between 10 and 20 (two different quantities) is 15. However, the SDOM adopted by Schmidt, Jones and Kennedy (Eq. 1) calculates 15±5 even when 10 and 20 indicate two different quantities and are error-free, which is clearly wrong because, for example, 11 or 17 are not be the mean of 10 and 20. The SDOM can be used only if 10 and 20 are two stochastic measures of the same thing of which one would like to estimate the best estimate.
Even more paradoxically, the erroneous adoption of the SDOM physically implies that Schmidt, Jones, and Kennedy assumed that the climate temperature of the Earth from 2011 to 2021 was constant, and that natural fluctuations such as ENSO and (natural and anthropogenic) trends are just errors of measure. To justify such a claim, Schmidt, Jones, and Kennedy even invented a new concept in climatology, the concept of “random nature” (perhaps derived from a parallel universe theory?). However, their interpretation of the temperature data is clearly nonphysical. Natural variability does not contribute to the error of measure of the data, but at most only to the error of a model regression coefficient of the data. However, here the issue was not to test an isothermal climate model of the type T
Then, Schmidt, Jones and Kennedy used their erroneous and inflated 0.10 °C error of the mean of the global surface temperature record from 2011 to 2021 to qualitatively claim that the conclusion of my GRL 2022 paper was wrong just because a very few GCM member simulations obtained with a very few GCM models with an ECS > 3 °C agree with the data within such erroneous interval, as Figure 1a shows. However, their own figure clearly shows that all the GCMs with ECS > 3 °C produce hindcasts that are statistically skewed toward temperature values larger than the warming reported by the data: see the green dots indicating the GCM average simulations. Thus, statistically speaking, such models run too hot. In fact, as my Figure 2 shows, when the right error of the mean is considered and the climate models are ensembled into three macro-GCM indicating the three ECS ranges (1.5–3.0 °C; 3.0–4.5 °C; and 4.5–6.0 °C) as did in my 2022 GRL paper and the proper statistics is evaluated also assuming some statistical dispersion due to their internal variability, the warm bias of the GCM groups with an ECS > 3.0 becomes evident. My figures are reported below.
In conclusion, the Comment by Schmidt, Jones, and Kennedy is flawed, both statistically and physically. Its publication, together with my Reply, is important only because pointing out such errors is also useful for educational purposes.
I need to add that this is not the first time that Schmidt has critiqued one of my works using severely flawed mathematics and logic. Some readers may remember that in 2009 Benestad and Schmidt published a paper in JGR (Benestad, R.E., and G.A. Schmidt, Solar trends and global warming, J. Geophys. Res. 114, D14101, 2009, [link], which was actually a kind of comment on some of my works. Here Schmidt made severe and naïve errors in the wavelet analysis and multilinear regression model, as I first demonstrated here [link]. Such errors obscured the empirically evident and significant solar contribution to climate change and might have misled the scientific community on this topic. For the interested readers, the detailed rebuttal of Benestad and Schmidt’s paper was later published here: Scafetta, N., Discussion on common errors in analyzing sea level accelerations, solar trends and global warming, Pattern Recognition in Physics 1, 37–57 [link]. Schmidt recently wrote other Real Climate flawed articles that critique papers that I have coauthored with Dr. Connolly, Dr. Soon, and many other colleagues which show the possibility that the sun can significantly contribute to climate change of the last century. The rebuttals of his critiques are found on [link].
In conclusion, these are cases that clearly demonstrate the necessity of having formal Comments and Replies published together to let the readers to properly evaluate both viewpoints. Thus, I am surprised that on RealClimate, Schmidt appears to complain that his Comment was not published by alone, before or even without my Reply. However, it is critical that professionally written Comments and Replies are published concurrently. Furthermore, for the sake of science, any form of political manipulation of journals behind the scenes (as the ClimateGate emails revealed link) must be abhorred. This must be done mostly for ethical reasons, notably to avoid potentially occurring instances of scientific disinformation campaigns promoted by the authors of the Comments and by various activist scientists.
People interested in knowing more about my climate-change research are invited to watch this recent YouTube presentation (15 Aug 2023, 2 hours)
Nicola Scafetta: Understanding Climate Change | Tom Nelson Pod #126