by Chris Morris
This report brings readers up-to-date with happening in the Australian generation industry since the previous posts: Australian Renewables Integration: Part 1, Part 2, Part 3. While many were optimistic about Australia’s planned changes, we were concerned that technical problems would emerge and that the costs of the transition will also make the power significantly more expensive for a less reliable supply.
The other articles Planning Engineer has written on Climate Etc. are well worth reading to explain electricity grid issues which many aren’t aware of. For Australia, Wattclarity needs a shoutout as they provide interesting articles to those who, or want to understand grid issues and electricity markets.
Another article is being prepared on New Zealand electricity generation as a compare and contrast exercise. It has a market structure based on Australia’s but a very different generation base, though the issues occurring are similar.
Overview of what has happened
Since Part 3 in March, the only big generation change has been the closure of Liddell, a nominal 2000MW coal fired power station in New South Wales (NSW). The two coal stations at Callide in Queensland (QLD) are still out-of-service following failures. This has caused significant ongoing market distortions in NSW & QLD which may improve when these units return to service. There have been uprating of equipment on the transmission network (mainly in southern NSW sub-stations) to carry heavier flows and the controlling software has been modified to incorporate new operating constraint rules. The grid operator has had to do many more market interventions to meet stability guidelines. Federal and State governments pushing their green electricity generation agenda have impacted the market adversely.
There have been no significant power outages in the last six months caused by lack of generation. However, there have been numerous close calls with only minimal reserves available. When a declared low reserves actually occurs, it needs only one major transmission line fault or a large generator to trip for load shedding to occur.
Though it might not necessarily lead to low reserves, very high spot market prices like those shown in Figure 1 now regularly occur. This is when transmission constraints, little wind and the sun going down is being matched by having to ramp up the expensive thermal generation. The merit order stack can be very steep. As expected by all but the most starry-eyed proponents, the much touted Big Batteries provide very little assistance in such situations. They make a lot more of their money on the much more lucrative very fast reserves market that was needed because of the increasing replacement of responsive thermal plant generation with wind and solar.

Fig 1 Grid power flows and prices for 30 May 2023 17:35. Note the interconnectors aren’t at rating here, illustrating constraints are in transmission system elsewhere. Battery contribution is purple sliver at top of generation type graph.
These very high short interval market spot prices have distorted the “average” prices. To quote the AER (the grid regulator) report on the situation:
“30-minute prices exceeded $5,000MWh 12 times over January to March 2023 – 5 times in Queensland, 3 in NSW and 4 in South Australia. This compares to 16 high prices over the same period last year,……, Price spikes, while short in duration, can have a material impact on average quarterly prices. The high price events covered in this report contributed between $7/MWh to $12/MWh to the quarterly average prices in Queensland, NSW and South Australia”
Since March, high price periods numbers have increased and there have been many more instances of price periods between $300 and $5000/MWh. Note that the averages quoted are just straight averaging the pricing; they do not take into account the market load at the time. This has the effect of distorting the average down from what would be the true figure of total energy supplied divided by total money charged.
Market intervention for stability and inertia often needed for the South Australia (SA) system. At times there, the duck curve has become a canyon (Figure 2). Much of the unwanted generation is shed by negative pricing, where it costs generators, particularly the semi-scheduled (wind and grid solar) to stay on. However, AEMO has regularly dispatched gas turbines to stay on in SA to maintain sufficient strength while removing grid solar and wind as they do not provide support. This occurs frequently when the spot price is negative. The costs of these interventions do not show up in the wholesale power price but in the network and other charges. As will be discussed later, that is why SA has relatively low wholesale power prices but very high retail ones. Together with that, states like SA offer retail subsidies that are a charge against the taxpayer, not the domestic energy customer – robbing Peter to pay Paul. This further distorts the market.

Fig 2 SA demand showing midday canyon in grid demand but gas kept on and very high gas and interconnector contributions morning and evening. Very little from batteries, especially in morning,
The cost to do the changes and market interventions has increased the cost of operating the AEMO which regards itself is at the lower cost end of its peers. Note the AEMO also runs the Western Australia (WA) and gas markets which are outside the National Electricity Market (NEM) – the Eastern states. As part of their operation, they operate over 30 small ring-fenced services which are nominally cost-neutral. Even so, just that one small part of the operation is about $40 a year per household. Customers may not pay this charge directly, but it affects the economy.
As mentioned earlier, there have been regular curtailments of grid solar (Figure 3) and wind farms (Figure 4), particularly during periods of negative market spot prices. These must come at a cost. There is very little market incentive for the semi-scheduled generation developers to build new plant, or maintain existing ones, if the market price isn’t there. That is why there are yet more subsidies. Coal also gets subsidised, but at about $0.40/MWh, which is mainly to maintain system stability and to be there when the renewables aren’t. This compares with the $74/MWh wind gets.

Fig 3 Grid solar daily curtailment Jan to March 2023

Fig 4 Wind farm daily curtailment Jan to March 2023
Negative Pricing
A common issue occurring on the electricity spot market now, especially over the summer, is low or even negative pricing. This is in the period 10am to around 4pm. Examples are shown in Figure 5. During these periods, the wind and grid solar can be constrained off but like Figure 2 shows, the gas turbines (GTs) continue to run in SA. As all the coal fired stations need to stay on, albeit at reduced load and lower efficiency, both to ramp up when the sun goes down and provide inertia/ system support. The coal stations operate at a loss during these times unless they have long term contracts for the power.

Fig 5 Low and negative grid pricing from all the solar generation. Domestic solar is largely unaffected because they are generally behind the meter and can’t be controlled.
The cost for coal stations to stay generating is being covered in a variety of ways, none of them good to the consumer. The bid stack price for when their generation is needed has to go up. This is reflected by the higher market spot price. They start and stop more often to try to generate only when the price they will receive is above their cost of generation. This raises costs of operation but doesn’t bring in more income.
The plants cut costs by reducing maintenance, availability or derating. Towards the end of its operation, the 500MW units at Liddell were down to less than 400MW. They don’t get the capital re-investment to refurbish, update and modernise plant to new best practices. This lack of money makes them less reliable, increasing the likelihood of them tripping often when their generation is most needed. And they are shut down, removing their needed dispatchable generation from the market. But they can be kept going and available by you guessed it, subsidies.
More wind farms
The proponents of wind are still pushing the line that the wind is blowing somewhere so a large spread of locations will balance their output. This is to counter the inconvenient graphs like the one in Figure 6.

Fig 6 Total Australia wind generation showing its unreliability (thanks TonyfromOz)
That 6GW loss is a lot of coal and gas fired power stations which need to ramp up to cover the decline. It would be in addition to those which covered the 4pm to 9am solar loss. Declines like this might not happen that often, but they occur. How many days a year would you be prepared to be without power if you were relying on wind? The weather conditions which caused this are shown in Figure 7. Now where would the somewhere be for the wind farms the proponents are hoping to find?

Fig 7 Weather maps for consecutive days showing sudden onset of no wind over continent
New Grid Storage
The answer that glibly rolls off renewable proponents’ tongues to the lack of reliability is “more storage”. They are building more batteries and have others on the drawing board but in terms of energy storage and the hole they would have to cover, these planned additions would be insignificant and at prohibitive cost.
The alternative is supposed to be Snowy2 ,an expansion of the hydropower in the Snowy mountains. It is touted as 2000GW pumped storage generator with 350GWh storage – less than a day’s electricity for the NEM. It was originally costed as $2B and it was to be finished by now. Cost is already above $12B, assuming no more problems and completion possibly 2029 . That is assuming they can stop the tunnelling machine getting stuck again. There is a new CEO for the government owned company that will operate it because the previous one was sacked for rubbishing the ridiculous claims of the Energy Minister about this and the gas turbine to run on green hydrogen. Politicians don’t like being shown wrong by engineering and common sense.
Remember that as well as the storage, you also need additional generation constructed to fill storage.
New Transmission Lines
As part of the Snowy2 scheme (and included in the original cost) was uprating the transmission lines needed to get the extra power into and out of the grid. This has run into difficulties. Landowners do not want to lose the land the power lines will occupy nor the restrictions on farming operations and practices that go with them. The government is planning to force through legislation to over-ride opposition. Energy experts are warning it will be a big mistake to build them but the Energy Minister wants to push ahead. Needless to say, costs have skyrocketed and they are behind schedule.
South Australia
The May market review about the State had this:
SA’s average May 2023 electricity spot prices more than doubled in price to $202/MWh compared to $78/MWh in April.
- At $202/MWh, prices are cheaper than in the same period last year when prices averaged $312/MWh.
- Price volatility was high, with one market cap event and 25 instances of pricing being close to $10,000 or more. Numerous negative pricing incidents were recorded but were less extreme than those in positive territory.
- Renewables dropped from 72% in April to 56.6% of total generation. Gas continued its upward trend from 27% the previous month to a staggering 42.6%.
- Battery power remained on par with last month at 6% and averaged a cost of $445/MWh. Gas cost an average of $293/MWh and renewables $108/MWh.
The South Australian Grid operator in their latest report saw increased import capacity as necessary – not 100% renewable, just 100% net renewable so they still want to sponge off other states when their unreliables don’t deliver. To do this, more interconnectors will be needed. Events like shown below (Figure 8) put a lie to their renewable generation credentials. And remember, it doesn’t show interconnector flows, which in this case would be inward.

Fig 8 SA generation – no wind, no solar, no battery. Very high electricity price.
Reality has bitten and SA will subsidise a company to keep a GT station operating. Odds are this will happen again.
Voltage Stability Issues
There are also problems starting to manifest themselves in regions that have high renewables penetration with unstable grid voltages, particularly sub-synchronous oscillations (frequencies <50Hz) (SSO). These are superimposed on the basic waveform, distorting it. They can rapidly age or even destroy other components on the grid, particularly transformers and spinning shafts. EPRI in the USA recognised and initiated cures for the problems fifty years ago, but they are coming back as more assets involve DC/AC inverters. AEMO believe the problem is serious enough to issue a warning, even for operators of synchronous condensers. It is very likely the problem will get worse and be at least a large contributor to a major outage before there is an impetus to fix it. One hopes that the solution will be “causer pays” by fines and/ or remedial modifications like it is for other grid disturbances, but I for one doubt it. Politicians don’t admit their own mistakes.
A recently reported development in the operation of grid is potentially more concerning than the lack of inertia or SSO. It has caused the unreliables to be dispatched off because of the lack of system strength becoming a risk to stability. System Strength is the ability of the power system to maintain a stable voltage waveform at any given location, both during steady state operation and following a disturbance. If it isn’t controlled, it can rapidly damage electrical equipment. The problem occurred up in north Queensland. As recently as last year, the AEMO did not identify this region as one of the areas of potential weakness. One region they did identify, Victoria, will need about $1B of infrastucture quickly installed to address the risk.
As a simple explanation as to what is happening; if the voltage waveform is defined as a continuous sinewave, SSO will cause a cyclic amplitude change to the wave while low system strength causes distortion of the shape of the wave.
How much electricity do the unreliables actually provide and when?
TonyfromOz collected a years’ worth of daily NEM data and analysed it for the contribution from each source for each time interval. This was averaged. Those values went on a graph for a single day closest to the average. The results shown in Figure 9 indicate just how much Australia still relies on fossil fuels, especially in the period 5pm to 7am. Figure 10 is the whole year’s data (plotted as daily totals) he analysed showing the still very high reliance on coal.
Fig 9 average yearly contribution of renewables per grid trading period

Fig 10 plot of daily summation data used to give the Fig 9 average plot. Note tiny amount of load (negative generation) at bottom of bars for pumped hydro and battery storage.
Increased Risk of Power Outages
AEMO recently released their ten year forecast document, which showed an increased risk of a shortfall between generation and load. The document itself described the situation as “perched on the edge”. This resulted from closing the coal stations, yet not building enough wind/ solar/ batteries to replace the loss of dispatchable power. They do list their assumptions in their scenarios – many of which have a significant effect on the model. All the acronyms, links and terminology in the document make it heavy reading and easy to misinterpret. An example of why you shouldn’t ask an electrical engineer to explain what you thought was a simple issue.
Some commentators have been predicting doom and gloom from this forecast, with more blackouts ahead. Others are relatively sanguine about it. As Wattclarity helpfully points out, for any single consumer using the numbers shown, a power cut is more likely to be from a problem in the distribution system rather than on the transmission or generation side. The perception is that people appear to be more accepting of say a car crash taking out a neighbourhood power pole, rather than not enough generation, even though the nett effect may be the same.
Electricity Pricing
There is a very big disconnect between market wholesale pricing and the charge to consumers. The reasons for this are discussed in the ACCC paper that now seems only to be available in the web archive. However, they broke down prices into network, wholesale plus hedging, environmental, retail and margin. For the snapshot in 2017-18 across the whole of the NEM, wholesale was 34%. For SA, it was 41% which was the highest domestic price of the states. What they wrote about SA was:
“The primary drivers of cost increases in South Australia have been wholesale costs and environmental costs. These components increased average bills by $171 and $158 respectively from 2007–08 to 2017–18. There was also a decrease in retail margin of $12 per customer during this time period. South Australia overall had the highest increase in effective prices of 14.6 c/kWh”
What the actual price component breakdown is now does not seem to be available. Even what is published may be distorted by subsidies and Feed-In Tariffs for those with domestic solar. However, by trawling through various documents on Wayback, what is shown in the tables below is the wholesale and domestic prices for the 5 states in NEM. Most of the electricity generated is not sold through the wholesale spot market but on longer term contracts.
It is not known which if any of the prices have any subsidies already built in. The comparisons are believed to be consistent between years, subject to all the provisos already discussed.

The present Federal government came to power promising cheaper electricity and promising acceleration away from thermal plant. Instead, the price has gone up markedly and they have realised they need coal. It will be interesting to see if there are electoral repercussions. The main opposition party had similar energy policies, just not as radical.
One doesn’t need to be Nostradamus to see the domestic cost of electricity is going to continue rising at a rate higher than inflation as the coal stations are shut down. If solar and wind were really cheaper for the grid, they would already have been built and not need financial incentives or workarounds. So more subsidies for the coal replacements will be needed.
With all the subsidies, it is lucky Australia can pay for them with taxes, and charges on iron ore, coal and LNG exports. This is rather than providing reliable power with cheap coal like they used to do. As Forrest Gump said “Stupid is as stupid does”.
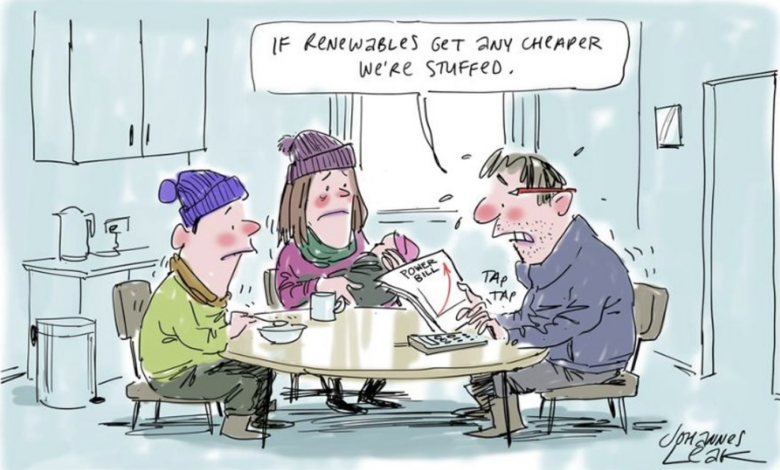
One of their major newspaper’s cartoonist got it right.

As was written on another blog: Renewables – the energy source so cheap, nobody can afford to build them.
The author thanks Planning Engineer for pushing him to write this update and for his significant editorial input. He also appreciates his workmates for the long smoko discussions about the meanings and importance of operational details