34 Years of Flawed, Failed & Grossly Misrepresented Global Sea Level Rise Speculation – Watts Up With That?

Guest essay by Larry Hamlin
For decades climate alarmists in the UK, EU and U.S. have been making flawed and failed exaggerated claims regarding accelerating global level sea level rise being caused by increasing man made CO2 emissions as one means of politically bullying the world’s nations into mandating immensely costly, bureaucratically onerous and completely ineffective global CO2 reductions from these nations.
The flawed CO2 reduction schemes in the EU and UK have created significant declines in energy availability and reliability because of these nations excessive reliance on unreliable, nondispatchable, backup power reliant and costly renewable energy. These politically contrived emissions and energy incompetent policies have resulted in greatly increasing energy costs for EU and UK nations that negatively impacted their economies while significantly increasing their dependence on energy from other nations.
This energy dependence includes greatly increased needs for natural gas, petroleum and coal supplies obtained through other nations and especially from Russia which (before sanctions) provided about 40% of the EU’s natural gas energy as well as being the EUs main supplier of crude oil (27%) and hard coal (49%). This data and other information concerning the EU and UK self-inflicted climate alarmist driven energy and economic debacle is addressed here, here and here.
The EUs efforts to build additional liquified natural gas terminals to wean itself off Russian gas is estimated to take at least three years with existing available import shipping facilities already maxed out. Renewables would take even longer. Any new LNG cargoes will have higher costs than the existing Russian pipelines. EU policy makers are stuck with politically damaging options including rationing energy and using more coal which means dumping climate goals. When push comes to shove emission reductions will take second place to economic survival with this huge energy and emissions policy turnaround already underway and being led by Germany.

Loss of western energy expertise in Russia resulting from sanctions could led to much higher emissions in Russia which is the largest emitter of methane in oil and gas production that leaks from its fossil-fuel infrastructure. China has become the major global manufacturing center producing emissions for the world making it far and away the largest emitter (emissions twice those of the U.S. with more emissions growth to come) and because of its global manufacturing role doesn’t even bother to play lip service to the alarmist driven propaganda hyping climate change goals. China along with economic growth desired by other developing nations will clearly push future global emissions upward as noted below.
Global emissions are climbing again and will clearly continue to climb ever upward in the coming years. After about a 5% reduction during the pandemic of 2020 global emissions have seen record highs in 2021 according to IEA with a 6% increase over 2020 levels with the CO2 atmospheric levels showing no trace of the 5% reduction in year 2020 as shown below. So much for the absurdly phony year 2021 scientifically false “climate emergency” proclaimed by the Democrats trying to support their failed COP26 debacle in Glasgow at a time when all 5 acknowledged global temperature anomalies measurement systems have been declining for the last 6+ years.

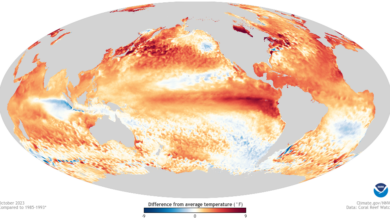
During all this global energy and economic turmoil caused by harebrained net zero-renewable energy climate alarmist propaganda the latest report was released by NOAA and other government agencies attempting to justify claims of ever-increasing rates of global sea level rise caused by man- made CO2 emissions.
While the harsh political and economic reality of the excessive renewable energy net zero policy mandate consequences and stupidity are now clearly visible and impossible to hide the alarmist world of global mean sea level rise is floundering with the ability to accurately “predict” future global sea level rise outcomes moving further into the future as demonstrated by the results of most recent year 2022 government sea level rise report published over the last 34 years starting with an historic Senate hearing in 1988.
The long and scientifically unsupported exaggerated history of flawed and failed rising sea level alarmist claims began in earnest in the U.S. in 1988 political theatrics showcase hearing in the nation’s Capital.
The Democratic Party escalated the politically driven climate alarmist dubious rising sea level claims in a hearing held on June 23, 1988 by the Senate Committee on Energy and Natural Resources in the Senate Dirksen Office Building in Washington D.C. addressed in detail here.
Dr. Michael Oppenheimer, Senior Scientist, Environmental Defense Fund wrongly testified that:
“Global mean temperature will likely rise at about 0.6 degrees F per decade and sea level at about 2.5 inches per decade.”
“These rates are about six times recent history.”
“Every decade of delay and implementation of greenhouse gas abatement policies ultimately adds perhaps a degree F of warming, and no policy can be fully implemented immediately in any event.”
NOAA global tide gauge data updated through year 2020 (more than three decades after the 1988 Senate hearings) estimates that the global absolute rate of sea level rise is about 0.7 inches per decade (between 1.7 to 1.8 mm/yr.) which is strikingly below Dr. Oppenheimer’s claim of 2.5 inches per decade increase.
Furthermore Dr. Oppenheimer’s claim that each decade of delay in implementing greenhouse gas abatement policies (global emissions grew by nearly 65% between 1988 and 2019 with this growth entirely dominated by the world’s developing nations led by China and India) adds another 1 Degree F of warming would mean that the three plus decades of continued growth in greenhouse gas emissions that have occurred since the 1988 hearing would have considerably increased his estimates of 0.6 degrees F temperature anomaly increase per decade and 2.5 inches of sea level rise increase per decade – assuming his alarmist claims ever had any merit.
Of course, all these flawed and proved false increasing global sea level rise claims made in the Democrats hearing were headlined in the climate alarmist propaganda press (just as they continue to be 34 years later only with newly flawed and fabricated erroneous global mean sea level claims) as shown below in the headlines of the June 24,1988 New York Times.

The first UN IPCC AR1 (FAR) climate report issued in 1990 provided yet another opportunity for climate alarmists to fabricate more flawed and failed exaggerated “predicted” claims about global sea level rise with the following study assessment.
“Simple models were used to calculate the rise in sea level to the year 2100, the results are illustrated below.”
“The sea level rise expected from 1990 to 2100 under the IPCC Business as-Usual emissions scenario is shown in Figure 12.”
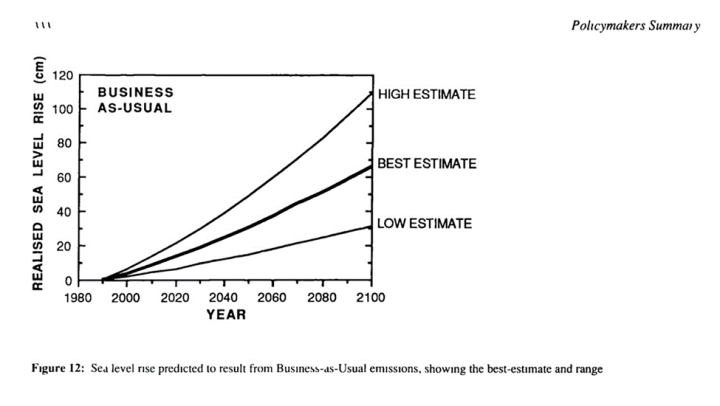
The FAR report notes that using the Best Estimate “predicted” case “The “predicted” rise is about 20cm (7.9 inches) in global mean sea level by 2030, and 65cm (25.6 inches) by the end of the next century.”
The FAR report High Estimate “predicted” estimate for year 2100 was 110cm (43.3 inches) and the Low Estimate “predicted” was 30cm (11.8 inches).
Using NOAA’s absolute rate of global sea level rise noted above of between 1.7 to 1.8 mm/yr. discussed above establishes that the increase between 1990 and 2030 would be about 7cm (2.75 inches over 40 years or 6.87 inches per century) not the 20cm “projected” in the FAR study with the NOAA estimated value being about 1/2 of what the Low Estimate “projection” of the FAR study graph shows for year 2030.
Additionally using this NOAA absolute sea level rise value results in the global sea level rise increase between 1990 to year 2020 being about 5.2cm (2 inches in 30 years).
The graph below shows a comparison of the NOAA linear trend measured tide gauge data for Los Angeles, California (used as an example of more than 100 U.S. NOAA coastal tide gauge measurement stations showing linear sea level rise data trends) over the period from 1923 through 2021 compared to the “predicted” accelerating sea level rise curves portrayed by the UN IPCC FAR study that falsely assert sea level rise acceleration starts in 1990.

For the 31-year period between 1990 and 2021 (NOAA tide gauge data updated through year 2021) the Los Angeles tide gauge data shows a steady increase of about 3.2cm (1.27 inches) which is about 1/2 of the FAR Low Estimate value “predicted” curve with no acceleration present as wrongly portrayed in the FAR study global sea level rise “predicted” curves.
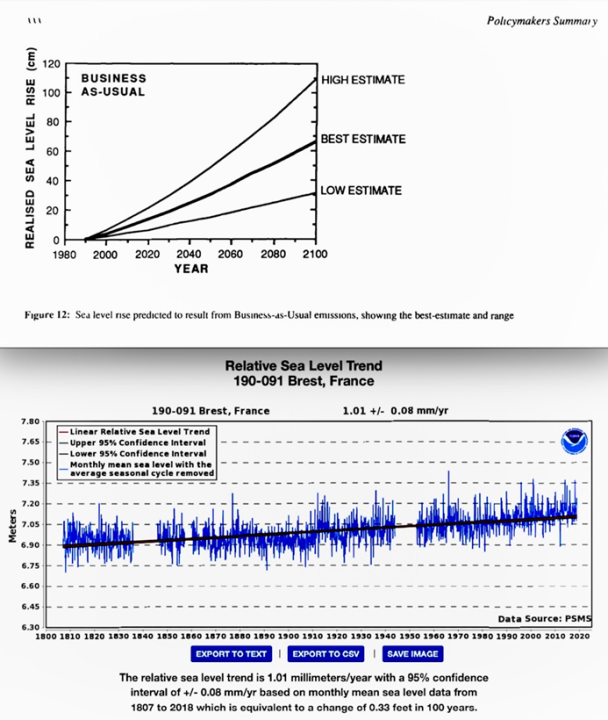
Hundreds of additional measured tide gauge data locations worldwide (using GLOSS/PSMSL world tide gauge station data) can be compared with the accelerating sea level rise curves as shown in the FAR “predicted” study as shown below for the more than 210 year long Brest France tide gauge measured data reflecting no acceleration with a steady sea level rise trend over its long history of about 0.33 feet (10cm) per century.
The FAR study over states the rise of global sea level rise by about a factor of 3 (year 2030 7cm increase versus 20cm increase by FAR’s Best Estimate “predicted” sea level rise with sea level rise acceleration starting in 1990) higher than the NOAA determined absolute sea level rise rate of 1.7 to 1.8 mm/yr. – yet another flawed and failed UN IPCC sea level rise scenario “predicted” outcome that the world’s nations were being asked to accept via this “settled science” based on flawed “scenarios” that falsely attempted to justify mandates for highly questionable, ineffective and costly CO2 reduction mandates.
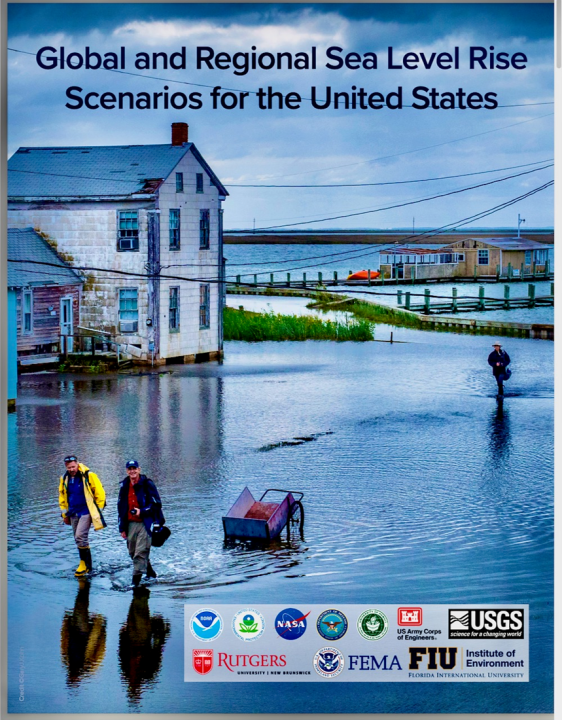
Moving on to the year 2012 study by government climate alarmists attempting to fabricate sea level rise increasing claims the Global Sea Level Rise Scenarios for the U.S. National Climate Assessment report is shown below.

This report was carried out by the Obama Administration reflecting his belief that we would be able to look back upon his nomination and tell our children that “this was the moment when the rise of the oceans began to slow and our planet began to heal.”
Besides the monumental hubris of this statement, it is apparent that President Obama was ignorant of the fact that the oceans have been rising for thousands of years since the end of the last ice age.
The rates of ocean sea level change have varied significantly over this time period with more recent studies showing greater detail of ocean sea level change information over about the last two hundred years. These changes in ocean sea level have occurred as a result of natural climate driven outcomes as clearly shown in information (slide #36) from a presentation by Dr. Judith Curry regarding global climate science issues.

By the end of the Obama Administration in January 2017 the rate of sea level rise at both Honolulu and Woods Hole (6 miles from Martha’s Vineyard Island) remained unchanged from January 2009 when he took office at 0.51 feet per century and 0.98 feet per century respectively (as shown below by NOAA tide gauge data updated through year 2021) thereby revealing that Obama’s post Presidential decisions to spend tens of millions of dollars to build and buy huge coastal mansions at Honolulu and Martha’s Vineyard coastal locations were unfettered by his and the Democratic Party politically contrived shenanigans about “the rise of the oceans”.

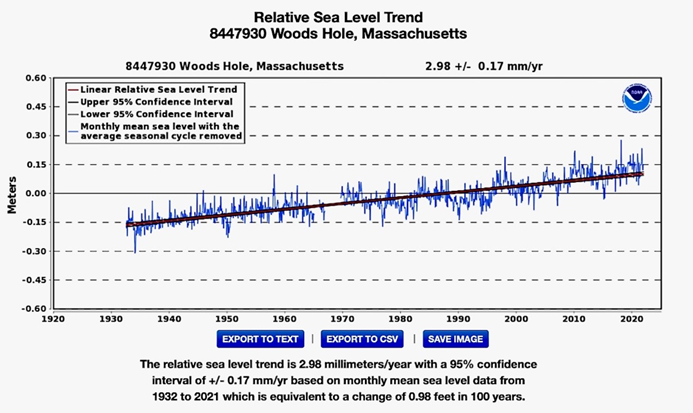
Additionally, the rates of sea level rise at both of Obama’s huge coastal mansion locations remain unchanged through year 2021 from those present during the 8 long years of the Obama Administration demonstrating that not only was he not able to slow “the rise of the oceans” but more importantly that Obama and the Democrats phony climate alarmist sea level rise claims were nothing but politically driven propaganda not science.
Like all government politically driven future sea level rise studies by climate alarmist’s new versions of accelerating global mean sea level rise claims are fabricated using sea level rise “scenario” models that show their completely speculative sea level rise trends accelerating in the future that the world will supposedly experience unless we act immediately to reduce CO2 emissions. This 2012 study sea level rise “scenario” models are shown below with sea level rise acceleration starting about year 2000 (as shown below) a decade later than the FAR study 1990 acceleration start year.
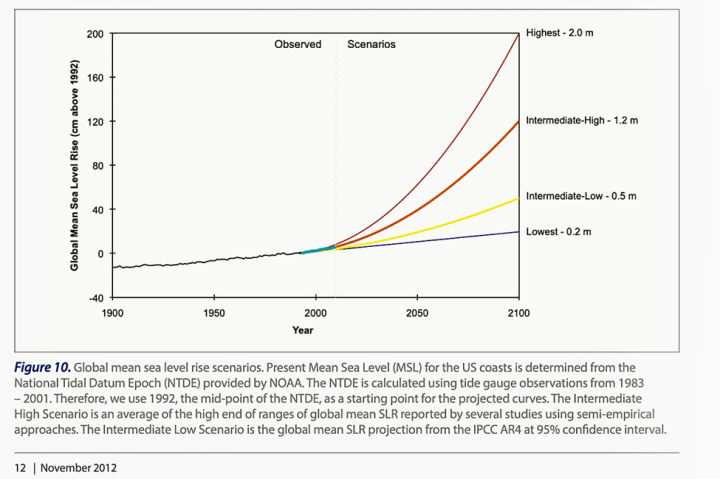
The 2012 report proposes 4 speculative global sea level rise scenarios but states very confidently that “We have very high confidence (>9 in 10 chance) that global mean sea level will rise at least 0.2 meters (8 inches) and no more than 2.0 meters (6.6 feet) by 2100.” The report offers a mid-range for its global sea level rise “scenario” of about 3 feet.
The term “high confidence” represents “expert opinion” by the authors of the report and is not derived from calculated probabilities for “scenarios” which of course have no defined probabilities as discussed below.
Compared to the FAR study the “new” year 2100 magically arrived at highest global sea level rise number is now 6.6 feet versus just 3.6 feet in the FAR study emulating the usual IPCC “it’s worse than we thought” mantra utilized for each new UN published climate report. Addressed below is a discussion of the lack of both certainty and credibility behind the new “worse than we thought” global sea level rise scenario “projections” (note the term “projection” is now used instead of the term “prediction” as used in the FAR study clearly showing the degree of certainty in these sea level rise claims is declining) from this Obama Administration study.
The alleged purpose of this study was to “help” local cities and communities “plan” for future sea level rise that could impact their locations. The report contains the following huge methodology uncertainty stipulations and inadequacies regarding the validity and applicability of these global mean sea level rise scenarios that will supposedly impact coastal communities and cities in the future:
“Scenarios do not predict future changes but describe future potential conditions in a manner that supports decision-making under conditions of uncertainty”.
“Probabilistic projections of future conditions are another form of scenarios not used in this report because this method remains an area of active research. No widely accepted method is currently available for producing probabilistic projections of sea level rise at actionable scales”.
“Thus, specific probabilities or likelihoods are not assigned to individual scenarios in this report, and none of these scenarios should be used in isolation”.
“None of these scenarios should be used in isolation, and experts and coastal managers should factor in locally and regionally specific information on climatic, physical, ecological, and biological processes and on the culture and economy of coastal communities.”
“Scientific observations at the local and regional scale are essential to action, and long-term coastal management actions (e.g., coastal habitat restoration) are sensitive to near-term rates and amounts of SLR.” (This would include use of hundreds of long time period local tide gauge measurement data which is unmentioned in the study)
Exactly how local communities and cities are supposed to use these scenarios for local sea level rise “decision-making under conditions of uncertainty” purposes given these extensive uncertainty limitations and inadequacies is unexplained.
Of course, when the climate alarmist news media address these studies all uncertainty limitations and inadequacies concerning the studies monumental guesswork are carefully concealed.
Instead media emphasize the flawed application of 6+ foot highest global mean sea level rise “projection” increases by 2100 to coastal locations (as noted numerous times in these global mean sea level rise government reports coastal sea level rise is subject to locally driven specific assessments that differentiate outcomes at these locations from GMSL outcomes) with alarmist headlines as shown, for example, in the L. A. Times article shown below.
These sea level rise climate alarmist news articles grossly exaggerate and misrepresent what these studies actually say by concealing huge study uncertainty and inadequacy limitations while hyping the speculative and ill-defined sea level rise scenario guesswork.

This often repeated pattern of flawed, failed and grossly misrepresented sea level rise studies is further addressed in the following material.
The 2012 Global Sea Level rise study discussed above was updated in a 2017 report shown below.

The 2017 report addressed the differences between this new study versus how the 2012 study was approached and conducted as discussed below from items noted in the 2017 report which discusses key sea level rise components, uncertainties and assumptions.
“Parris et al. (2012) recognized the need for an interagency effort to define a set of future possible GMSL rise scenarios for coastal planning, policy, and management to allow for recognition of trend changes and adaptive management strategies (USACE, 2013).
Because of the large uncertainties involved in predictions of the land-based ice melt contribution to GMSL rise and the significant consequences associated with impossible-to-rule-out extreme outcomes, Parris et al. (2012) recommended a scenario approach covering a broad range (0.2 m to 2.0 m GMSL rise by 2100) of existing sea level study results (trends, process modeling, semi-empirical approaches, etc.).”
“In order to bound the set of GMSL rise scenarios for year 2100, we assessed the most up-to-date scientific literature on scientifically supported upper-end GMSL projections, including recent observational and modeling literature related to the potential for rapid ice melt in Greenland and Antarctica.”
“To ensure consistency with these recent updates to the peer-reviewed scientific literature, we recommend a revised ‘extreme’ upper-bound scenario for GMSL rise of 2.5 m by the year 2100, which is 0.5 m higher than the upper bound scenario from Parris et al. (2012) employed by the Third NCA (NCA3).” (Third National Climate Assessment NCA 2014)
“This report articulates the linkages between scenario-based and probabilistic projections of future sea levels for coastal-risk planning, management of long-lived critical infrastructure, mission readiness, and other purposes. The probabilistic projections discussed in this report recognize the inherent dependency (conditionality) of future GMSL rise on future greenhouse-gas emissions and associated ocean-atmosphere warming.” (The 2017 study incorporates the use of AR5 climate model RCPs into its analysis which was not done in the 2012 study)
“The RCPs provide a set of possible future greenhouse gas concentrations through the year 2300 and were used by the IPCC AR5. Each RCP represents possible underlying (though implicit) socioeconomic conditions and technological considerations, including a low-end member (RCP2.6) requiring strong mitigation (net- negative emissions in the last decades of the 21st century), a moderate mitigation member (RCP4.5) stabilizing emissions through 2050 and declining thereafter, and a high-end, fossil-fuel-intensive, ‘business-as-usual’ emission scenario (RCP8.5).”
“Under the methodological assumptions of Kopp et al. (2014), in 2100 the Low scenario has a 94% to 100% chance of being exceeded under RCP2.6 and RCP8.5, respectively, whereas the Extreme scenario has a 0.05% to a 0.1% chance of being exceeded.”


Table 4 supposedly represents a proposed framework for “decision-making under conditions of uncertainty” where the RCP uncertainties are now expressed as probabilities in terms of exceeding a specific but also uncertain sea level rise scenario.
Table 4 probabilities do not represent the likelihood of any specific sea level rise outcomes actual occurrence which cannot be established because of inadequacies of the RCPs and global sea level rise scenarios.
The climate alarmist news media conceal the “decision-making under conditions of uncertainty” probability characterizations represented by Table 4 and erroneously emphasize the “Extreme (2.5 m)” GMSL rise scenario (as discussed further below) in their misleading articles that grossly misrepresent what the Table 4 study actually says.
How these Table 4 “probability of exceeding” values was determined is addressed below.
After the theatrics of the 1988 Senate hearing on global warming the UN IPCC had conducted several climate analysis reports and concluded that there are significant limitations to climate models being able to provide accurate future climate predictions that cannot be overcome.
The UN IPCC Third Assessment Report (AR3) was issued in year 2001 more than a decade after the 1988 hearing. That report finally acknowledged that it is not possible to develop climate models that can accurately model global climate and provide future climate predictions.
Specifically, the report in Section 14.2.2.2 noted:
“In sum, a strategy must recognize what is possible. In climate research and modeling, we should recognize that we are dealing with a coupled non-linear chaotic system, and therefore that the long-term prediction of future climate states is not possible. The most we can expect to achieve is the prediction of the probability distribution of the system’s future possible states by generation of ensembles model solutions.”
UN IPCC Assessment Reports to date provide climate model scenarios (referred to as RCPs) that are used to suggest various possible climate states in the future. The RCPs that were included in the AR5 report issued in 2013 were identified as RCP 2.6, RCP 4.5, RCP 6.0 and RCP 8.5 with assumed greenhouse gas emissions varied from low scenario (2.6) to high scenario (8.5) along with numerous other assumptions.
However, the validity of these climate scenarios is significantly qualified in the AR5 climate report with the following limitations:
“The scenarios should be considered plausible and illustrative, and do not have probabilities attached to them.” (12.3.1; Box1.1)
The RCP2.6, RCP4.5 and RCP8.5 used in the NOAA 2017 study have no probabilities associated with their emissions scenario outcomes nor are there associated defined probabilities for the resulting warming impacts that are estimated for ocean thermal expansion, mass loss from glaciers, ice caps, and ice sheets or for varying non-climatic ground LSL (local sea level) uplift or subsidence. So how are these “probabilities” in Table 4 established?
Going to the 2017 studies methodological assumptions source for the probabilities Kopp et al. (2014) as shown in Table 4 above we find the following critical information regarding what lies behind these numbers and the process that defined them as highlighted in the significant items from this study discussed below.

“Here we present a global set of local sea-level (LSL) projections to inform decisions on timescales ranging from the coming decades through the 22nd century.”
“We provide complete probability distributions, informed by a combination of expert community assessment, expert elicitation, and process modeling.”
The term “expert elicitation” means the following:
“In science, engineering, and research, expert elicitation is the synthesis of opinions of authorities of a subject where there is uncertainty due to insufficient data or when such data is unattainable because of physical constraints or lack of resources.”
So, the stated “probabilities” are “opinion” driven because of uncertainty, insufficient and unattainable data and not the result of calculated outcomes from well-defined scientifically established emission scenarios, global mean sea level rise scenarios and process models.
Continuing with the Kopp (2014) study we find further discussion of the analysis methodology limitations, uncertainties and inadequacies addressed as follows:
“Between the years 2000 and 2100, we project a very likely (90% probability) GSL rise of 0.5–1.2 m under representative concentration pathway (RCP) 8.5, 0.4–0.9 m under RCP 4.5, and 0.3–0.8 m under RCP 2.6.” (e.g., Table 4 is developed via “expert community assessment”, “expert elicitation”, “process modeling” and RCP models that are “plausible” and/or “illustrative”.)
“Site-to-site differences in LSL projections are due to varying non-climatic background uplift or subsidence, oceanographic effects, and spatially variable responses of the geoid and the lithosphere to shrinking land ice.“
“The Antarctic ice sheet (AIS) constitutes a growing share of variance in GSL and LSL projections. In the global average and at many locations, it is the dominant source of variance in late 21st century projections, though at some sites oceanographic processes contribute the largest share throughout the century.”
“The future rate of mean global sea-level (GSL) rise will be controlled primarily by the thermal expansion of ocean water and by mass loss from glaciers, ice caps, and ice sheets [Church et al., 2013].”
“Local sea-level (LSL) change can differ significantly from GSL rise [Milne et al., 2009; Stammer et al., 2013], so for adaptation planning and risk management, localized assessments are critical.”
“Projections of changes in GSL due to thermal expansion and in LSL due to regional steric and dynamic effects are based upon the CMIP5 GCMs.” (GCMs have no associated probabilities but are only considered as “plausible” or “illustrative.”)
“Consistent with AR5’s judgment that the 5th–95th percentile of CMIP5 output represents a likely (67% probability) range for global mean thermal expansion” (More “expert elicitation”).
“As shown in the previous section, LSL rise is controlled by different factors—both climatic and non-climatic—at different locations and intervals over the next two centuries.”
“While all LSL projections are sensitive to assumptions about ice sheet behavior (process modeling), some are sensitive to assumptions about confidence in GCM output.” (GCMs have no assigned probabilities)
“There remains a need for improved ice sheet models to allow robust projections of the ice sheet component without heavy reliance upon expert elicitation.” (process modeling outcomes driven by “expert elicitation”)
“However, the development of such models is hindered by the limited consensus on the magnitude of positive and negative feedbacks on ice loss, such as those involving (a) temperature and snow albedo [Picard et al., 2012], (b) forest fires and snow albedo [Keegan et al., 2014], (c) snowfall and ice sheet discharge [Winkelmann et al., 2012], (d) grounding line retreat [Joughin et al., 2014; Rignot et al., 2014; Schoof, 2007], (e) static-equilibrium sea-level and grounding line retreat [Gomez et al., 2010, 2012, 2013], (f) meltwater, ocean temperature, sea ice, and snowfall [Bintanja et al., 2013], and (g) ice-cliff collapse [Bassis and Walker, 2012; Pollard and DeConto, 2013].(Process models are acknowledged as having numerous and significant inadequacies and uncertainties)
The wide range of projections and underlying uncertainties in continental-scale model projections pose challenges for interpreting the likelihood of their results [Bindschadler et al., 2013].” (More process model uncertainty and inadequacies)
“Furthermore, structural errors in models of other sea level components remain probable.” (process modeling inadequacies impact ice sheet, ice caps & glaciers mass loss, ocean warming, vertical land movement, etc.)
“Under RCP 8.5, we project a very likely mean global sea-level rise of 0.5–1.2 m by 2100 and 1.0–3.7 m by 2200, which under the strong emissions mitigation of RCP 2.6 is lowered to 0.3–0.8 m by 2100 and 0.3–2.4 m by 2200. (See Table 4).” (More “expert elicitation”)
“Local sea-level rise projections differ from the global mean due to differing background rates of non-climatic sea-level change, spatially variable responses to different land ice reservoirs due to static-equilibrium effects, and spatially variable ocean steric and dynamic changes.”
Returning to the NOAA 2017 study we find these additional descriptions of how the study was done and what it intended to accomplish besides being used by the climate alarmist media to hype higher global mean sea level rise numbers.
“Significant uncertainties exist about the exact trajectory (and impacts) of future climate change, limiting the value of prediction-based frameworks for long-term, climate-related decision-making (e.g., see Hallegatte et al. 2012, Weaver et al., 2013).”
The above statement is extremely revealing because it clearly establishes that the scenarios contained in the Global Mean Sea Level Rise RCP curves shown above are inappropriate for use in making “prediction-based” climate-related outcomes regarding global sea level rise. Thus, the need to construct a “decision-making under conditions of uncertainty” framework. This outcome is further re-enforced in the additional items from the 2017 study presented below.
“This approach is consistent with that recommended in Kopp et al. (2016b) and used by the Thames Estuary 2100 project (Ranger et al., 2013; Hinkel et al., 2015). Continuous monitoring of current sea level behaviors (trends and variability), along with improved scientific understanding of relevant climate-system processes and feedbacks, can then help identify the evolution of the system over time with respect to these mid-range and worst-case scenarios.”
“This technical report provides results and discussion related to two primary tasks: 1) developing an updated scenario range for possible 21st century GMSL rise and 2) producing a set of gridded RSL response along the United States coastline based on discrete scenarios drawn from this updated GMSL rise range. For the first task, we assessed recent observational and modeling literature on worst-case GMSL projections.”
“This deployment of scenarios and tools will help serve as a starting point for on-the-ground coastal preparedness planning and risk management processes needed to ensure that U.S. coastal communities (and their economies) remain vibrant and resilient to ongoing and future changes in sea level.”
The language used in the NOAA 2017 study is clearly intended to establish that the study is a work in progress in laying out an approach (“decision-making under conditions of uncertainty”) for dealing with the still largely poorly defined and complex climate issues associated with global mean sea level rise and local sea level rise as demonstrated by the numerous and significant scientific shortcomings of the both the climate scenarios (RCPs large and ill-defined uncertainty) and process modeling capabilities (inability to accurately define ocean warming, glaciers, ice caps and ice sheets mass loss or gain, non-climatic sea-level change background uplift or subsidence) discussed in detail in the 2017 study as noted above but ignored and concealed by the climate alarmist media.
The climate alarmist media grossly failed to address and instead concealed these critically important scientific evaluation contexts, limitations, qualifications and inadequacies and instead hyped climate alarmism driven outcomes with an example shown in the article below where specific sea level rise increases are exaggerated (e.g. 6.6 foot sea level rise becomes 8.2 foot sea level rise) without any attempt to define the study context (to develop a framework for “decision-making under conditions of uncertainty”) along with the studies extensive and significant inadequacies and uncertainty that underly how these global mean sea level rise study numbers were developed and what they really mean.

Specifically, the above article (as representative of virtually all media presentations) hyped the following:
“A 2012 NOAA report on global sea-level rise included four possible climate scenarios, each involving different degrees of ocean warming and glacier melting around the world: one scenario with high sea-level rise, one with low sea-level rise and two intermediate scenarios. The report suggested that the most extreme scenario could result in 6.6 feet of global mean sea-level rise by the year 2100. At a minimum, it suggested 0.7 feet of sea-level rise by that time.
The new report includes six possible climate scenarios, and it updates both the highest and lowest sea-level-rise estimates. It suggests that in the most extreme scenario, global mean sea levels could rise 8.2 feet by the year 2100. And in the lowest scenario, sea levels may rise by about one foot by the end of the century.
The authors decided on these updates by consulting a number of recent published studies on the subject. The increase in the upper extreme estimate from 6.6 feet to 8.2 feet was partly based on an improved understanding of the physical processes affecting the world’s major ice sheets, Sweet noted.
He pointed to several recent studies modeling the response of the Antarctic ice sheet to climate change. Such studies have helped shed new light on the increasing instability of the ice sheets in areas like West Antarctica and the conditions that could lead them to collapse in the future. The updated research is “suggestive that these higher [sea-level rise] outcomes are more probable than we once thought they were,” Sweet said.”
Ironically and as discussed in the analysis of the latest study (2022 GMSL report shown below) the Antarctic 8.2-foot sea level rise scenario so hyped by media relative to the 2017 study was abandoned in the year 2022 study because that scenario is now considered as being “implausible” (expert elicitation and process modeling) although this significant change was concealed by climate alarmist media stories addressing the GMSL rise 2022 study.
The 2017 article noted above along with many other climate alarmist articles that allegedly discussed the 2017 study were devoid of any discussion of the need for a work in progress starting point defined as “decision-making under conditions of uncertainty” framework that is required because of the large inadequacies and uncertainties present in trying to define GMSL rise outcomes as addressed in detail above.
Instead, these media articles treat and present the 2017 studies sea level rise claims as though they represent accurate “prediction based” climate related outcomes when that clearly is not the case as demonstrated by large uncertainty, inadequacies and limitations of the methodology as discussed above and further summarized below.
The article (and others like it) is devoid of any discussion of the lack of definable probabilities of either the CMIP5 climate models or global sea level rise scenarios, failed to address the significant inadequacies and limitations of the process models for defining thermal expansion of ocean water, mass loss from glaciers, ice caps, and ice sheets and inadequacies of regional and local uplift and/or subsidence data, failed to discuss the extensive use of subjective “expert elicitation” and “expert community assessment” because of large analysis methodology “uncertainty” along with the caution that “structural errors” are “probable” in process models, etc., etc.
The media climate alarmist articles are universal in grossly misrepresenting the huge inadequacies and uncertainty contained in future global sea level rise assessments by their failure to address these overwhelming analytical inadequacies that dictated the need to abandon “predicted” based GMSL climate outcomes and instead create a future information oriented “decision making under conditions of uncertainty” evolving sea level rise assessment framework.
The latest NOAA published report allegedly addressing global sea level rise titled 2022 Sea Level Rise Technical Report is shown below and available here.
This latest 2022 report continues with the prior 2017 reports development of a framework for “decision-making under conditions of uncertainty” as discussed above in detail in this post and as addressed in the Conclusion of section of the 2022 report as follows (recognizing that as was the case for the 2017 Global Sea Level Rise report and as is the case for this most recent 2022 Global Sea Level Rise report neither the GMSL Rise Scenarios nor the IPCC AR6 updated RCPs have defined probabilities and are acknowledged as being in a state of uncertainly)
“It is the goal of the Sea Level Rise and Coastal Flood Hazard Scenarios and Tools Interagency Task Force to continue to provide projections and future scenarios to assist decision-makers for both planning and risk-bounding purposes.
This report builds upon the progress made in Sweet et al. (2017), updating the GMSL scenarios and the associated local and regional RSL projections to reflect recent advances in sea level science, as well as expanding the types of scenario information provided to better serve stakeholder needs for coastal risk management and adaptation planning.“
“In addition, it is important to note that the projections do not include natural year-to-year sea level variability that occurs along U.S. coastlines in response to climatic modes such as the El Niño–Southern Oscillation.
Nevertheless, if we assume that regional sea level will keep following its present trajectory (the term “trajectory” in the NOAA 2022 report is used instead of “projection” and represents an “extrapolation” of existing observed trends versus model outcomes which are identified as “projections” as discussed further below) for the coming three decades, most U.S. regions are mostly tracking between the Intermediate-Low and Intermediate-High scenarios.
Although the near-term observation-based extrapolations will continue to evolve over time with new observations and analyses, this updated information should help inform both near-term decisions and projects that may require decades’ worth of planning prior to actual implementation.”
This statement again reflects the “work in progress” context of the 2022 study (as did the 2017 study) that it is intended to facilitate the ability to utilize future global mean sea level rise scientific assessments that can better define and establish significantly lower levels of uncertainty and inadequacies that presently exist which preclude the use of “prediction based” global mean sea level rise climate outcomes.
“In order to do so, additional and improved observations and more sophisticated modeling approaches that incorporate the relevant physical processes (e.g., waves; see Box 3.1) will be needed at the regional scale, with local granularity to assess the impacts of these coastal hazards. Such information is expected to ultimately feed into the next generation of interagency reports and assessments to enable informed climate adaptation planning.”
The 2022 reports Introduction Section further emphasizes the framing of the “decision-making under conditions of uncertainty” process that is intended for continued future updating and evaluation in addressing sea level rise as follows:
“it is important to emphasize the distinction between describing scientific progress, in terms of current understanding and key uncertainties, and translating such advances in the scientific knowledge base into actionable science. The latter requires sustained engagement by groups such as NOAA’s Office of Coast Management and Sea Grant program with users, stakeholder groups, and associated boundary organizations regarding their specific planning and decision contexts.”
“we thus aim to provide our screening-level (suitable for first-order-assessment) products appropriate for framing and bounding important problems in coastal risk assessment and management, along with contextualization of the underlying science and illustrative case studies.”
“What this report does NOT provide is official guidance nor design specifications for a specific project.”
The 2022 report addresses future global mean sea level assessments in Section 2 as follows:
“One of the main structural changes from the Sweet et al. (2017) report to this one is a specific emphasis on the near-term time period, 2020–2050. There is also a detailed discussion of GMSL scenario divergence and tracking that becomes particularly important in the transition from the near term to the long term.”
“In this report, an assessment based solely on extrapolation of the observed rates and acceleration out to 2050 is used for trajectory tracking and a comparison to the GMSL and regional scenarios. These trajectories serve as an additional line of evidence for near-term sea level rise and provide a mostly independent (observational VLM information is shared in both) comparison to the model-based scenario.
To maintain a distinction between estimates arising from observations and those coming from model-derived GMSL scenarios, the observation-based assessments are referred to in this report as “extrapolations” or “trajectories” and not as “projections.” These terms are also preceded by “observation-based” whenever used.”
Thus, we have at least two different arenas of “uncertainty” components in GMSL rise future scenarios. Shorter term GMSL rise uncertainty between 2020 and 2050 using “extrapolations” and/or “trajectories” based upon “observed rates” and “acceleration” out to 2050 and climate model-driven GMSL rise scenario “projections” beyond year 2050.
“Sweet et al. (2017) filtered the ensemble of different future projections generated by Kopp et al. (2014) to identify those subsets consistent with 0.3 m, 0.5 m, 1.0 m, 1.5 m, 2.0 m, and 2.5 m of 21st-century GMSL rise. These subsets constituted the six Sweet et al. (2017) GMSL scenarios.”
“This report retains the Sweet et al. (2017) scenarios (except the Extreme 2.5 m scenario, discussed below), with the principal difference being updated temporal trajectories and exceedance probabilities now based on global warming levels rather than emissions scenarios.”
“In addition to being updated based on the latest generation of GCMs and the IPCC AR6, this set of projections incorporates multiple methods of projecting future ice-sheet changes, which are the major sources of future sea level rise and pose the biggest source of uncertainty in projecting the timing and magnitude of future possible rise amounts.”
“An important change from the Sweet et al. (2017) report is the exclusion of the Extreme (2.5 m) scenario in this report.
Based on the most recent scientific understanding and as discussed in the IPCC AR6, the uncertain physical processes such as ice-sheet loss that could lead to much higher increases in sea level are now viewed as less plausible in the coming decades before potentially becoming a factor toward the end of the 21st century and beyond. A GMSL increase of 2.5 m by 2100 is thus viewed as less plausible, and the associated scenario has been removed from this report.”
The elimination of the year 2017 studies highest 2.5 m extreme sea level rise scenario in the 2022 study is completely concealed by the climate alarmist mainstream media. Additionally, the decision to eliminate the 2.5-meter scenario reflects the “work in progress” nature of the “decision-making under conditions of uncertainty” framework that has been completely concealed by the climate alarmist media.
“After 2050, the assessments and comparisons made using the observation-based extrapolations of future sea level rise become less informative and should be made with caution.
This is because uncertainty in the current estimates of rates and accelerations leads to large projected ranges and because current estimates may not be reflective of shifts or process changes that may occur in the future with additional emissions and global warming, resulting in increasing divergence between the future GMSL scenarios after 2050.”
The 2022 study “uncertainty” issues are summarized as follows:
“Two types of uncertainty are important to consider in this context: uncertainty in physical processes and uncertainty in future emissions and ensuing warming.
Although there are possible alternative definitions and framings, as used in this report, process uncertainty (Box 2.1) is associated with how well we currently understand why sea level has changed in the past and how it will change in the future. Stated another way, how well do we understand and model the processes that will combine to impact sea level at a specific time and location in the future?
This uncertainty is also reflected in the likely range of future sea level rise for a given GMSL scenario.
The spread between the five GMSL rise scenarios is intended to reflect the range of potential future emissions pathways and associated warming levels that depends highly on global socioeconomic factors that have yet to unfold.
This unknown future pathway leads to what is referred to here as emissions uncertainty (Box 2.1).”
“At some point in the future, the separation between GMSL rise scenarios will overtake the process uncertainty associated with individual GMSL rise scenarios.
In other words, scenario dependence will emerge, and it will be possible to distinguish between the observation-based trajectories associated with two neighboring GMSL rise scenarios. In general, these time periods are important for connecting the near-term similarities between scenarios to the time period where scenarios diverge rapidly.
An effort is made here to understand when divergence of the GMSL rise scenarios might occur and to link them to possible future warming and emissions pathways. This analysis then serves as the foundation for process-based monitoring that could be useful in determining the trajectory of ongoing sea level rise and, by extension, the possible future sea level rise out to 2150.”

Specifically identified under Process Uncertainty is the following “For example, the sensitivity of the Antarctic ice sheets is not yet fully understood, (even though this process is the “dominant source” of longer term global mean sea level rise as noted in both the 2017 and 2022 NOAA studies) leading to a substantial uncertainty in how sea level reacts to forcing changes.
Additionally, the future conditions from processes, such as changes in ocean circulation and VLM, that impact RSL change more locally have uncertainty”.
Emissions Uncertainty is noted as “Various forcing scenarios describe possible GHG emission pathways, which range from quick emissions reductions to unmitigated future emissions.”
“The uncertainty in the future pathway is referred to as emissions uncertainty.”
Under Natural Variability it is noted that “Next to sea level changes caused by changes in GHG forcing, many physical processes cause natural variation (e.g., ENSO). The scenarios and uncertainty ranges for each scenario and for the observation-based trajectories in this report do not include variations due to natural variability.”
The updated GMSL values in 2050, 2100, and 2150 relative to a 2000 baseline are shown for each of the five scenarios in Table 2.3.
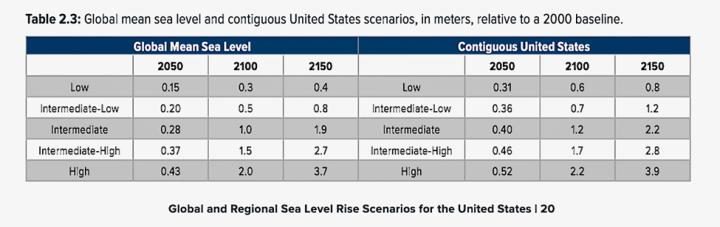
“However, these projections include only physical processes in which there is at least medium confidence in the current scientific understanding. As described in the IPCC AR6 (Box 9.4 in Fox-Kemper et al., 2021), the largest potential contributions to long-term GMSL rise come from ice-sheet processes in which there is currently low confidence.”
“Because these outcomes are based on processes poorly represented in climate ice-sheet models, the IPCC assessment of these processes incorporates information from a structured “expert-judgement” study (Bamber et al., 2019) and a single Antarctic ice-sheet modeling study that explicitly incorporates ice-sheet hydrofracturing and ice-cliff collapse mechanisms (DeConto et al., 2021).”
In what has become the “normal” distortion and deception tactics of climate alarmist’s media the year 2022 studies extensive global sea level rise uncertainty, RCP inadequacies and uncertainties and ill-defined process modeling issues are concealed by the media.
Instead climate alarmist media exaggerate global sea level rise speculative “extrapolations”, “trajectories” and “projections” (as was the case for the 2012 and 2017 global sea level rise reports as discussed above) with headlined alarmism statements, among many other such flawed assertions, that the U.S. “will experience as much sea level rise in the next 30 years as it did in the last 100 years”, “seas lapping against America’s coastlines are rising ever faster and will be 10 to 12 inches higher by the year 2050, “sea levels along the coastal United States will rise by about a foot or more on average by 2050”, “parts of Louisiana and Texas projected to see waters a foot and a half (0.45 meters) higher”, “by 2050, sea lapping against the U.S. shore will be 10 to 12 inches (0.25 to 0.3 meters) higher”, “at least two feet of sea-level rise is expected by the end of the century”, etc., etc.
The 2020 global sea level rise study made none of these media “prediction” asserted claims as demonstrated by the detailed sea level rise uncertainty and process modeling inadequacy information from the study as presented above.
As was the case for prior global sea level rise alarmist media reports the huge uncertainties and inadequacies of the climate model sea level rise scenarios and process models are unaddressed, the “decision making under conditions of uncertainty” framework driven by the inability to establish credible “prediction” based outcomes is concealed, the continued use of subjective “expert elicitation”, “expert community assessment” and inadequate “process modeling” is concealed, the fact that the 2022 report continues the “work in progress” context as did the 2017 report is concealed, etc., etc.
The ability to define credible future global mean sea level rise estimates awaits further extensive development of new scientific data and analysis that can be evaluated under the “decision-making under conditions of uncertainty” framework in an undefined future timeframe.
In the Introduction Section of the 2022 GMSL rise study it is claimed that tide gauge data for both global and contiguous U.S. locations shows coastal sea level rise acceleration has been underway since abut 1970 as noted below:
“Increases in GMSL provide an important indicator of the changing climate, but it is the sea level rise on local and regional scales—measured by the global network of tide gauges and satellites—that is most relevant for coastal communities around the world. Regional and local sea level rise has not been and will not be uniform in time or space. Rather, sea levels change locally for a variety of reasons, such as vertical land motion (VLM), which can exacerbate the effects of the rising ocean.
For context, whereas GMSL has risen by about 17 cm over the last 100 years (1920–2020), with noted acceleration since about 1970, relative sea level (RSL) averaged along the contiguous United States (CONUS) has risen about 28 cm over the same period with similar onset of acceleration (Figure 1.2b).”

1.2b) GMSL change (blue line) as shown in a) with the annual average relative sea level change measured by tide gauges around the contiguous United States (black line; with a linear regression estimate of 28 cm of sea level rise from 1920 to 2020). (Adaptation of Frederikse et al., 2020).
The “acceleration” claim is derived from a study which utilized both data and models to allegedly arrive at the “acceleration” finding using a “team of scientists to develop a state-of-the-art framework that pulls together the advances in each area of study – from sea level models to satellite observations – to improve our understanding of the factors affecting sea level rise for the past 120 years.”
This sea level rise acceleration claim is addressed at a WUWT article here with the article noting the following:
“Thomas Frederikse and colleagues published a study of sea level data, considering both tide gauges and satellite data in 2020 (Frederikse, et al., 2020).”
“They found that there are many causes of global and regional sea level change that need to be considered. Land over much of the Northern Hemisphere is still rebounding from the melting of the massive glaciers they supported during the Last Glacial Maximum. This causes many northern tide gauges to record sea level falling as the land rises. Further, dam construction during the twentieth century caused water to be withheld from the oceans and stored in reservoirs on land, especially between 1960 and 1980. They also tell us that previous assessments of sea level were unable to reconcile observations with the calculated contributions of ice-mass loss, dam construction, and thermal expansion of water.”
“The observations of sea level, ocean temperature, ice-mass loss, water held in man-made reservoirs, and total river discharge to the oceans all have considerable uncertainty, which is why studies have not been able to close the gap between observations. Frederikse and colleagues make another attempt to close the gap. They note that over the past few years much more accurate estimates of all the critical observations have been made available and they collected these in a new estimate.”
“The results of his study (Frederikse at al) increase the previous estimates of GMSL (global mean sea level) rise in the 1960s and 1970s, after excluding the effect of dam construction. His model also increases the uncertainty prior to 1940.
The match is quite poor in the 1920s and 1930s, and the steep rise in sea level from 1930 to 1950, nearly as rapid as in the 21st century, is also not matched well.”
“it is clear that the data shown in Figures 1 and 2 are not accurate enough to conclude that the overall rate of sea level rise is accelerating, in fact it is possible that we will see a deceleration of sea level rise in the near future.”
“In this part we show that the error in estimating sea level rise and its components is so large that showing acceleration definitively is probably not possible. In the next post we will discuss the problems with that approach and provide a more statistically sound projection of the rate of sea level rise.”
The sea level rise “acceleration” since 1970 claim is also addressed at another WUWT article here with the article noting the following
“More on Sea Levels: In his discussion on the Scientific Method, Richard Feynman insisted that a scrupulous scientist must present all the data, including the data that is not favorable to his pet idea, his hypothesis.
A favorite trick of some is to put together two different datasets taken by two different sets of instruments or methods, showing different trends over different time intervals, but to eliminate the data that shows the datasets are not similar and have different trends.“
The “eliminated data” referred to above is the extensive Permanent Service for Mean Sea Level Rise (PSMSL) data base which is described by NOAA as follows:
“Various tide gauge networks have contributed to GLOSS, each with a different focus and each changing over time as research priorities evolve. The main component is the GLOSS Core Network (GCN), a global set of ~300 tide gauges that serves as the backbone of the global in situ sea level network. GCN gauges were allocated to each island or group of islands at intervals not closer than 500 km, and along continental coasts at intervals generally not less than 1000 km. Preference was given to islands in order to maximize exposure to the open ocean.”
“Established in 1933, the Permanent Service for Mean Sea Level (PSMSL) is responsible for the collection, publication, analysis and interpretation of sea level data from the global network of tide gauges, including the GLOSS Core Network. It is based in Liverpool at the National Oceanography Centre (NOC). PSMSL generally relies on Member Nations to provide the final version of the monthly time series with all quality control assessments applied and documented.
Where possible, in order to construct time series of sea level measurements at each station, the monthly and annual means are reduced to a common datum. This reduction is performed by the PSMSL making use of the tide gauge datum history provided by the supplying authority. The PSMSL archive comprises of ‘delayed-mode’ monthly mean sea level values most suitable for studies of long-term sea-level change; most studies of 20th century global sea level rise are based on the PSMSL data set.”

Returning to the prior WUWT article above the use of PSMSL data is addressed as follows:
“We are seeing this again with NASA claims of sea level rise since 1900. Using data from the UK PSMSL (Permanent Service for Mean Sea Level), Paul Homeward addresses the claims using data for two geologically stable locations. There are short term trends of increasing sea level rise and decreasing sea level rise. For example, in the 1970s sea levels fell at Newlyn, UK, in the 1960s sea levels fell and then rose in the 1970s at North Shields, UK. Homewood writes:”
“This pattern of a slowdown or fall in sea levels in the 1960s and 70s is seen at many other sites around the world, as are rates of rise as high as now in the decades prior to that.“
“Both phenomena are, of course, consistent with warming in the Arctic in the 1920s and 30s, followed by the much colder interlude there, which ended in the 1990s. Global temperatures followed the same pattern too.“
“Although the overall rate of rise is around 2mm a year, because of periods when there was no rise at all there have been other periods when sea levels have been rising faster.”
“Annual sea level rise of around 3mm a year was typical prior to the cooldown and is similar to what is being reported now by satellites.”
“Whether we enter another period of AMO [Atlantic Multidecadal Oscillation] related cooling in coming decades remains to be seen. But what the data conclusively shows is that, as far as the UK is concerned, the recent rate of sea level rise is not unprecedented, nor is there any evidence of it accelerating.“
“Those who become excited over short-term sea-level trends need to review Richard Feynman on the scientific method. See links under Changing Seas.”
The Changing Seas heading for the WUWT article addresses a study using UK tide gauge PSMSL data to evaluate accelerated sea level rise since 1970 as noted below at locations which exhibit geological stability and do not show acceleration since the 1970s.

The article breaks down the PSMSL data on a decadal basis to obtain a more insightful understanding of the sea level rise behavior over time as shown below.

“At Newlyn, there was a sharp rise in sea levels during the 1980s, but this presumably must be seen in context with the fall in the 1970s.
Similarly at North Shields, the fall in the 1960s and rise in the 1970s.
At both sites, sea level rise has actually slowed in the last decade. (The data available at North Shields, though not complete, shows a continued drop in sea level in 2018 and 2019).
And in both cases, the latest decadal rise is less than seen in some decades in the 20thC.
It is fair to add that the rise post 2000 is connected to the pause in sea level rise in the 1990s. The latter was of course the direct consequence of the Pinatubo explosion, which led to several years of global cooling.”
“This pattern of a slowdown or fall in sea levels in the 1960s and 70s is seen at many other sites around the world, as are rates of rise as high as now in the decades prior to that“.
The article concludes:
“Whether we enter another period of AMO related cooling in coming decades remains to be seen. But what the data conclusively shows is that, as far as the UK is concerned, the recent rate of sea level rise is not unprecedented, nor is there any evidence of it accelerating.”
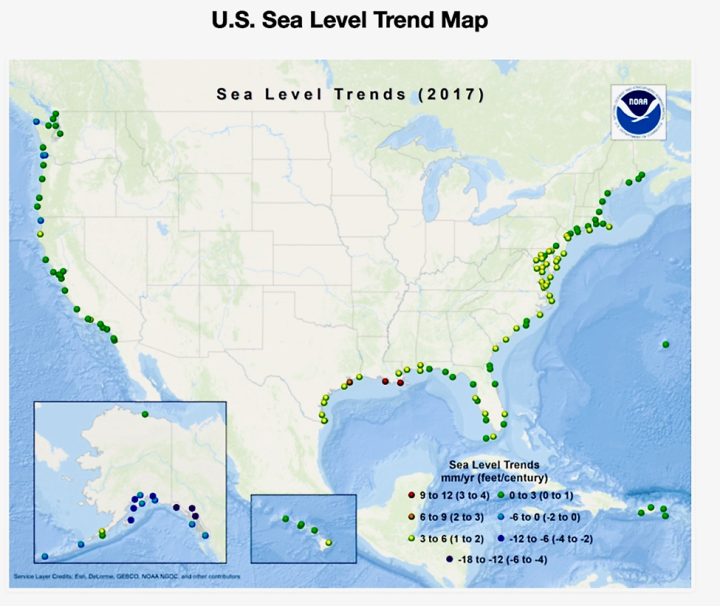
NOAA U.S. long-term sea-level trend tide gauge stations (based on a minimum of 30 years of data) are identified relative to whether they are experiencing significant vertical land motion noted as follows:
“The map of relative sea level trends provides an overview of variations in the rates of local sea level change at long-term tide stations (based on a minimum of 30 years of data in order to account for long-term sea level variations and reduce errors in computing sea level trends based on monthly mean sea level).
The variations in sea level trends seen here primarily reflect differences in rates and sources of vertical land motion. Areas experiencing little-to-no change in relative sea level are illustrated in green, including stations consistent with average global sea level rise rate of 1.7-1.8 mm/yr. These are stations not experiencing significant vertical land motion. Stations illustrated with positive sea level trends (yellow-to-red) are experiencing both global sea level rise, and lowering or sinking of the local land, causing an apparently exaggerated rate of relative sea level rise. Stations illustrated with negative trends (blue-to-purple) are experiencing global sea level rise and a greater vertical rise in the local land, causing an apparent decrease in relative sea level. These rates of relative sea level rise reflect actual observations and must be accounted for in any coastal planning or engineering applications.”
NOAA Technical Report NOS CO-OPS 053 evaluated sea level variations of the U.S. from 1854-2006 in a 2009 analysis as shown below.
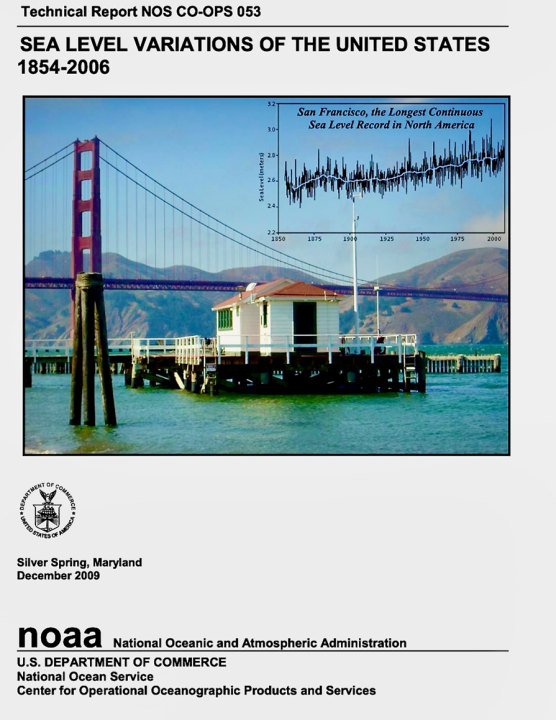
The Executive Summary of the report notes:
“Monthly mean sea level (MSL) data for 128 long-term National Water Level Observation Network (NWLON) stations of the Center for Operational Oceanographic Products and Services (CO-OPS) are analyzed in this report. All available data up to the end of 2006 are used to determine linear trends, average seasonal cycles, and interannual variability including estimated errors. The stations are located on the U.S. Atlantic and Pacific coasts, the Gulf of Mexico, Hawaii, Alaska, and on islands in the Atlantic and Pacific Oceans.
The linear trends obtained are relative MSL trends which are a combination of the absolute global rate of sea level rise (1.7 +/- 0.5 mm/yr in the 20th century) and the rate of any local vertical land motion. The variation in vertical land motion, ranging from rapid subsidence in Louisiana and eastern Texas to rapid uplift in Alaska, is primarily responsible for the regional differences in MSL trends and for the differing rates within regions. Separate pre- and post- seismic trends were calculated for some stations in Alaska and Guam with apparent seismic offsets in 1957, 1964, or 1993.”
“Each calculated linear trend has an associated 95% confidence interval that is primarily dependent on the year range of data for each station. A derived inverse power relationship indicates that 50-60 years of data are required to obtain a trend with a 95% confidence interval of +/- 0.5 mm/yr. This dependence on record length is caused by the interannual variability in the observations. A series of 50-year segments were used to obtain linear MSL trends for the stations with over 80 years of data.
None of the stations showed consistently increasing or decreasing 50-year MSL trends, although there was statistically significant multidecadal variability on the U.S. east coast with higher rates in the 1930s, 1940s and 1950s and lower rates in the 1960s and 1970s.”
The report’s Conclusion notes:
“This report is a re-analysis of mean sea level variations in the United States using monthly MSL data from long-term NWLON stations with a data range of at least 30 years. The report follows the format of Zervas (2001) with seven additional years of data and presents results for 12 additional stations. A total of 128 stations were analyzed for linear trends, autoregressive coefficients, average seasonal cycles, and interannual variability along with their 95% confidence intervals. The stations are located on the U.S. east and west coasts, the Gulf of Mexico, Alaska, Hawaii, Bermuda, the Caribbean, and on islands in the Pacific Ocean (Figures 1-7, Appendix I).
The two oldest stations, The Battery and San Francisco, have records beginning in the 1850s. The maintenance of these long-term time series depends on the continued monitoring of tidal bench marks. The reference elevations of the station datums have been preserved despite the occasionally-required relocations of some of the stations.”
“Eight NWLON stations now have data spanning periods of over 100 years. These stations are The Battery, Philadelphia, Baltimore, Fernandina Beach, San Diego, San Francisco, Seattle, and Honolulu. Figure 35 graphically summarizes these CO-OPS data sets and demonstrates the value of continuous, long-term sea level measurements. Together, these series represent the effect of globally-rising sea levels on most of the U.S. coastline. Although there is a small amount of subsidence at The Battery, Philadelphia, and Baltimore (about 1 mm/yr), the other five stations have negligible vertical land motion and therefore have been recording the absolute global 20th century sea level rise of 1.7 mm/yr (Douglas, 1991).
As shown in Figure 35, the importance of the demonstrated global sea level rise derived from the long-term sea level observations is analogous to the importance of the atmospheric CO2 observations to the global climate system.“

“Figure 35. Comparison of the atmospheric carbon dioxide record at Mauna Loa, Hawaii since 1958 (from http://www.esrl.noaa.gov/gmd/ccgg/trends/co2_data_mlo.html) and monthly mean sea levels at eight NWLON stations with record lengths of over 100 years.”
NOAA has updated its U.S. sea level rise data and trends to year 2021.
Provided below are the eight NWLON tide gauge station trends shown above that span more than 100 years of measured data with the additional 15 years of new data since the 1854-2006 NOAA study updated through year 2021 showing continued absence of “acceleration” since 1970. These trends do not reflect that they are being driven by global atmospheric CO2 levels as measured at Mauna Loa Observatory since 1958 as shown above.

The tide gauge measured data outcomes addressed in this NOAA 1854 to 2006 study and other WUWT posts noted above clearly indicate that the 2022 Global Mean Sea Level Rise study claims of tide gauge data measurements showing sea level rise acceleration occurring since 1970 are exaggerated and unsupported at numerous global locations with these acceleration claims more likely being an artifact of the studies analysis methodology (use of models) and not representative of real world tide gauge measurement trends.
The 2022 Global Sea Level Rise study “extrapolations” and “trajectories” used for assessing sea level rise during the 30-year period between 2020 and 2050 rely upon speculative and methodologically inadequate and uncertain claims of accelerating tide gauge measurements that are not supported by other well established global tide gauge data analysis. These inadequacies result in flawed claims of higher rates of global sea level rise during this 2020 to 2050 period asserted in the latest year 2022 GMSL study.