From mountain peaks to ocean depths, climate change continued its advance in 2022, … Droughts, floods and heatwaves affected … every continent … Antarctic sea ice fell to its lowest extent .. melting … European glaciers …
WMO annual report highlights continuous advance of climate change
Climate
Publicado
21 April 2023
Press Release Number:
21042023
Geneva, 21 April 2023 (WMO) – From mountain peaks to ocean depths, climate change continued its advance in 2022, according to the annual report from the World Meteorological Organization (WMO). Droughts, floods and heatwaves affected communities on every continent and cost many billions of dollars. Antarctic sea ice fell to its lowest extent on record and the melting of some European glaciers was, literally, off the charts.
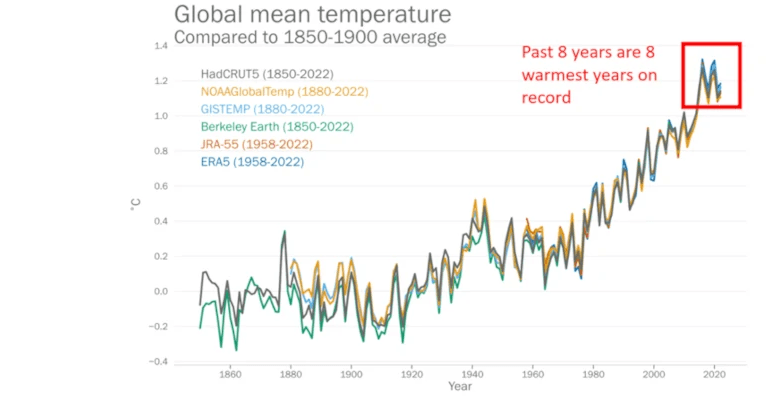
The State of the Global Climate 2022 shows the planetary scale changes on land, in the ocean and in the atmosphere caused by record levels of heat-trapping greenhouse gases. For global temperature, the years 2015-2022 were the eight warmest on record despite the cooling impact of a La Niña event for the past three years. Melting of glaciers and sea level rise – which again reached record levels in 2022 – will continue to up to thousands of years.
“While greenhouse gas emissions continue to rise and the climate continues to change, populations worldwide continue to be gravely impacted by extreme weather and climate events. For example, in 2022, continuous drought in East Africa, record breaking rainfall in Pakistan and record-breaking heatwaves in China and Europe affected tens of millions, drove food insecurity, boosted mass migration, and cost billions of dollars in loss and damage,” said WMO Secretary-General Prof. Petteri Taalas.
The new WMO report is accompanied by a story map, which provides information for policy makers on how the climate change indicators are playing out, and which also shows how improved technology makes the transition to renewable energy cheaper and more accessible than ever.
In addition to climate indicators, the report focuses on impacts. Rising undernourishment has been exacerbated by the compounded effects of hydrometeorological hazards and COVID-19, as well as of protracted conflicts and violence.
Throughout the year, hazardous climate and weather-related events drove new population displacement and worsened conditions for many of the 95 million people already living in displacement at the beginning of the year, according to the report.
The report also puts a spotlight on ecosystems and the environment and shows how climate change is affecting recurring events in nature, such as when trees blossom, or birds migrate.
The WMO State of the Global Climate report was released ahead of Earth Day 2023. Its key findings echo the message of UN Secretary-General António Guterres for Earth Day.
“We have the tools, the knowledge, and the solutions. But we must pick up the pace. We need accelerated climate action with deeper, faster emissions cuts to limit global temperature rise to 1.5 degree Celsius. We also need massively scaled-up investments in adaptation and resilience, particularly for the most vulnerable countries and communities who have done the least to cause the crisis,” said Mr Guterres.
The WMO report follows the release of the State of the Climate in Europe report by the EU’s Copernicus Climate Change Service. It complements the Intergovernmental Panel on Climate Change (IPCC) Sixth Assessment report, which includes data up to 2020.
Dozens of experts contribute to the report, including National Meteorological and Hydrological Services (NMHSs) and Global Data and Analysis Centers, as well as Regional Climate Centres, the World Climate Research Programme (WCRP), the Global Atmosphere Watch (GAW), the Global Cryosphere Watch and Copernicus Climate Change Service operated by ECMWF.
United Nations partners include the Food and Agriculture Organization of the United Nations (FAO), Intergovernmental Oceanographic Commission of UNESCO (UNESCO-IOC), International Organization for Migration (IOM), the United Nations Environment Programme (UNEP), UN High Commissioner for Refugees (UNHCR), the UN Office for Disaster Risk Reduction (UNDRR) and the World Food Programme (WFP).

Key Messages
Climate Indicators
Global mean temperature in 2022 was 1.15 [1.02 to 1.28] °C above the 1850-1900 average. The years 2015 to 2022 were the eight warmest in the instrumental record back to 1850. 2022 was the 5th or 6th warmest year. This was despite three consecutive years of a cooling La Niña – such a “triple-dip” La Niña has happened only three times in the past 50 years.
Concentrations of the three main greenhouse gases – carbon dioxide, methane, and nitrous oxide – reached record observed highs in 2021, the latest year for which consolidated global values are available (1984-2021). The annual increase in methane concentration from 2020 to 2021 was the highest on record. Real-time data from specific locations show levels of the three greenhouse gases continued to increase in 2022.
Reference glaciers for which we have long-term observations experienced an average thickness change of over −1.3 metres between October 2021 and October 2022. This loss is much larger than the average of the last decade. Six of the ten most negative mass balance years on record (1950-2022) occurred since 2015. The cumulative thickness loss since 1970 amounts to almost 30 m.
The European Alps smashed records for glacier melt due to a combination of little winter snow, an intrusion of Saharan dust in March 2022 and heatwaves between May and early September.
In Switzerland, 6% of the glacier ice volume was lost between 2021 and 2022 – and one third between 2001 and 2022.For the first time in history, no snow survived the summer melt season even at the very highest measurement sites and thus no accumulation of fresh ice occurred. A Swiss weather balloon recorded 0 C at a height of 5 184 m on 25 July, the highest recorded zero-degree line in the 69-year record and only the second time that the height of the zero-degree line had exceeded 5 000 m (16 404 feet). New record temperatures were reported from the summit of Mont Blanc.
Measurements on glaciers in High Mountain Asia, western North America, South America and parts of the Arctic also reveal substantial glacier mass losses. There were some mass gains in Iceland and Northern Norway associated with higher-than-average precipitation and a relatively cool summer.
According to the IPCC, globally the glaciers lost more than 6000 Gt of ice over the period 1993-2019. This represents an equivalent water volume of 75 lakes the size of Lac Leman (also known as Lake Geneva), the largest lake in Western Europe.
The Greenland Ice Sheet ended with a negative total mass balance for the 26th year in a row.
Sea ice in Antarctica dropped to 1.92 million km2 on February 25, 2022, the lowest level on record and almost 1 million km2 below the long-term (1991-2020) mean. For the rest of the year, it was continuously below average, with record lows in June and July.
Arctic sea ice in September at the end of the summer melt tied for the 11th lowest monthly minimum ice extent in the satellite record.
Ocean heat content reached a new observed record high in 2022. Around 90% of the energy trapped in the climate system by greenhouse gases goes into the ocean, somewhat ameliorating even higher temperature increases but posing risks to marine ecosystems. Ocean warming rates have been particularly high in the past two decades. Despite continuing La Niña conditions, 58% of the ocean surface experienced at least one marine heatwave during 2022.
Global mean sea level (GMSL) continued to rise in 2022, reaching a new record high for the satellite altimeter record (1993-2022). The rate of global mean sea level rise has doubled between the first decade of the satellite record (1993-2002, 2.27 mm∙yr–) and the last (2013-2022, 4.62 mm∙yr).
For the period 2005-2019, total land ice loss from glaciers, Greenland, and Antarctica contributed 36% to the GMSL rise, and ocean warming (through thermal expansion) contributed 55%. Variations in land water storage contributed less than 10%.
Ocean acidification: CO2 reacts with seawater resulting in a decrease of pH referred to as ‘ocean acidification’. Ocean acidification threatens organisms and ecosystem services. The IPCC Sixth Assessment Report concluded that “There is very high confidence that open ocean surface pH is now the lowest it has been for at least 26 [thousand years] and current rates of pH change are unprecedented since at least that time.
Socio-economic and environmental impacts
Drought gripped East Africa. Rainfall has been below-average in five consecutive wet seasons, the longest such sequence in 40 years. As of January 2023, it was estimated that over 20 million people faced acute food insecurity across the region, under the effects of the drought and other shocks.
Record breaking rain in July and August led to extensive flooding in Pakistan. There were over 1 700 deaths, and 33 million people were affected, while almost 8 million people were displaced. Total damage and economic losses were assessed at US$ 30 billion. July (181% above normal) and August (243% above normal) were each the wettest on record nationally.
Record breaking heatwaves affected Europe during the summer. In some areas, extreme heat was coupled with exceptionally dry conditions. Excess deaths associated with the heat in Europe exceeded 15 000 in total across Spain, Germany, the UK, France, and Portugal.
China had its most extensive and long-lasting heatwave since national records began, extending from mid-June to the end of August and resulting in the hottest summer on record by a margin of more than 0.5 °C. It was also the second-driest summer on record.
Food insecurity: As of 2021, 2.3 billion people faced food insecurity, of which 924 million people faced severe food insecurity. Projections estimated 767.9 million people facing undernourishment in 2021, 9.8% of the global population. Half of these are in Asia and one third in Africa.
Heatwaves in the 2022 pre-monsoon season in India and Pakistan caused a decline in crop yields. This, combined with the banning of wheat exports and restrictions on rice exports in India after the start of the conflict in Ukraine, threatened the availability, access, and stability of staple foods within international food markets and posed high risks to countries already affected by shortages of staple foods.
Displacement: In Somalia, almost 1.2 million people became internally displaced by the catastrophic impacts of drought on pastoral and farming livelihoods and hunger during the year, of whom more than 60 000 people crossed into Ethiopia and Kenya during the same period. Concurrently, Somalia was hosting almost 35 000 refugees and asylum seekers in drought-affected areas. A further 512 000 internal displacements associated with drought were recorded in Ethiopia.
The flooding in Pakistan affected some 33 million people, including about 800 000 Afghan refugees hosted in affected districts. By October, around 8 million people have been internally displaced by the floods with some 585 000 sheltering in relief sites.
Environment: Climate change has important consequences for ecosystems and the environment. For example, a recent assessment focusing on the unique high-elevation area around the Tibetan Plateau, the largest storehouse of snow and ice outside the Arctic and Antarctic, found that global warming is causing the temperate zone to expand.
Climate change is also affecting recurring events in nature, such as when trees blossom, or birds migrate. For example, flowering of cherry blossom in Japan has been documented since AD 801 and has shifted to earlier dates since the late nineteenth century due to the effects of climate change and urban development. In 2021, the full flowering date was 26 March, the earliest recorded in over 1200 years. In 2022, the flowering date was 1 April.
Not all species in an ecosystem respond to the same climate influences or at the same rates. For example, spring arrival times of 117 European migratory bird species over five decades show increasing levels of mismatch to other spring events, such as leaf out and insect flight, which are important for bird survival. Such mismatches are likely to have contributed to population decline in some migrant species, particularly those wintering in sub-Saharan Africa.
Notes for Editors
Information used in this report is sourced from a large number of National Meteorological and Hydrological Services (NMHSs) and associated institutions, as well as Regional Climate Centres, the World Climate Research Programme (WCRP), the Global Atmosphere Watch (GAW), the Global Cryosphere Watch and the EU’s Copernicus Climate Change services. United Nations partners include the Food and Agriculture Organization of the United Nations (FAO), Intergovernmental Oceanographic Commission of UNESCO (UNESCO-IOC), International Organization for Migration (IOM), the United Nations Environment Programme (UNEP), UN High Commissioner for Refugees (UNHCR), the UN Office for Disaster Risk Reduction (UNDRR) and the World Food Programme (WFP).
WMO extends its gratitude for all the dedicated hard work from WMO’s network of experts which makes this report an authoritative source of information on the state of the climate and on climate impacts. We are especially grateful to John Kennedy, who acted as lead author of this report.
Where possible the WMO climatological standard normal, 1991-2020, is used as a base period for consistent reporting. For some indicators however, it is not possible to use this baseline due to a lack of measurement during the whole period or because a longer period is needed to calculate representative statistics.
For global mean temperature, a baseline of 1850-1900 is used. This is the baseline used in recent IPCC reports as a stand in for pre-industrial temperatures and is relevant for understanding progress relative to the aims of the Paris Agreement.
WMO uses six international datasets for temperatures HadCRUT.5.0.1.0 (UK Met Office), NOAAGlobalTemp v5 (USA), NASA GISTEMP v4 (USA), Berkeley Earth (USA), ERA5 (ECMWF), JRA-55 (Japan).
The World Meteorological Organization is the United Nations System’s authoritative voice on Weather, Climate and Water
For further information contact:
Clare Nullis, WMO media officer, [email protected]. Tel 41-79-709 13 97
The suggestion that a little global warming is disaster is an absurdity.
We do have other sea temperature data, mostly surface temperature measurements of varying quality. Ocean surface temperature actually fell between 1940 and 1980. Did global warming take a holiday during these 40 years? Or is ocean heat content and heat flows yet another large and poorly understood climate system, which displays significant independence from the alleged driver of global warming?
Global mean sea level (GMSL) continued to rise in 2022 … 4.62mm / year. So what? I once had a house which was low laying enough to be at risk from tidal flooding. The next owner elevated the floor by 30cm. At 4.62mm / year sea level rise, that’s good for 65 years of additional protection, until the risk of flooding returns to the level I accepted. Even if sea level rise was to accelerate to 6mm, how long do houses normally last a without major renovation? The sea level rise rate snow and for the foreseeable future can easily be accommodated by regular maintenance of homes and urban infrastructure like roads and sea walls.
There is nothing new about adapting to changes in sea level. The title of my home actually to 3ft depth under water, because the original title was granted in the 12th century by King John, brother of King Richard the Lionheart, King John who is the main villain in the story of the legendary outlaw Robin Hood. Since the 12th century, through 800 years of land subsidence, much of the original land title is now permanently submerged. Yet the house I lived in for a time was dry and mostly flood free. All those centuries, through 800 years during which the sea gradually encroached on the land, successive owners adapted and kept their home dry, staying ahead of those changes in sea level, just as we and our descendants will adapt to any future changes in sea level.
Record breaking heatwaves in Europe – like the European Megadrought of 1531-1540? A period of mass starvation, crop failures, searing heat, melting glaciers? I wonder how the 1500s Europeans hid all their fossil fuel use from today’s historians?
The claim the Pakistan drought is climate related is also absurd.
… Droughts in Pakistan region are mainly due to various kinds of failures of rains from southwest monsoon. Also there seems to be some association between El Nino and La Nina events and weak monsoons. Pakistan frequently experiences several droughts. The Punjab province experienced the worst droughts in 1899, 1920 and 1935. Khyber Pakhtunkhwa (KPK) experienced the worst droughts in 1902 and 1951, while Sindh had its worst droughts in 1871, 1881,1899,1931,1947 and 1999. Over more than hundred year’s period between 1871-1988, 11 out of 21 drought years were El Nino years. The El Nino phase of the Southern Oscillations (ENSO) has direct impact on drought in Pakistan as it poses mainly negative impact on summer monsoon. …
Read more: Pakistan Government / Drought bulletin of Pakistan, 2013
The Pakistan Government bulletin also mentioned climate change is making the extremes more extreme, but strangely doesn’t give any additional context beyond a single bland statement, in stark contrast to the rest of the document which strives to provide a detailed explanation of Pakistan’s rain and drought cycles – almost like the climate claim was tacked on later, by someone other than the original authors.
What about food insecurity? Food insecurity is rising – absolutely. The price of fertiliser and agricultural chemicals has gone through the roof. Why are these chemicals becoming so expensive? Because the cost of production is related to the cost of energy. Manufacturing fertiliser especially requires a great deal of heat and pressure, which has to be supplied via energy intensive mechanical processes. Add the disruption of the Ukraine war to world food availability, and the Western war on agriculture, and it is not difficult to understand why a lot of people are having trouble getting enough to eat in today’s world.
Displacement in Somalia? If I lived in a nightmare terrorist run hellhole like Somalia, I’d probably want to be “displaced” as well.
Japanese cherry blossoms blooming early? So what? Might help offset some of that food insecurity caused by the Western energy policy and fertiliser availability catastrophe.
In my opinion the WMO has produced a big load of empty hype. They made no effort to present and discuss the merits of obvious alternative explanations for their claims in the press release, though the report is a little more measured in its explanations.
The biggest problem the WMO hilighted, food insecurity, is fixable. If the problems with food production were resolved, such as a cessation of the European, Canadian and New Zealand wars on agriculture and energy affordability, and if there was a resolution to the conflict in Ukraine, so Ukraine and Russia can get back to unfettered production and export of food, food prices would rapidly return to affordable levels.