Why matching of CMIP5 model-simulated to observed warming does not indicate model skill
A well-known Dutch journalist, Maarten Keulemans of De Volkskrant, recently tweeted an open letter to the Nobel-prizewinning physicist Professor Clauser in response to his signing of the Clintel World Climate Declaration that “There is no climate emergency”, asking for his response to various questions. One of these was:
The CLINTEL Declaration states that the world has warmed “significantly less than predicted by (the) IPCC”. Yet, a simple check of the models versus observed warming demonstrates that “climate models published since 1973 have generally been quite skillful predicting future warming”, as Zeke Hausfather’s team at Berkeley Earth recently analysed.
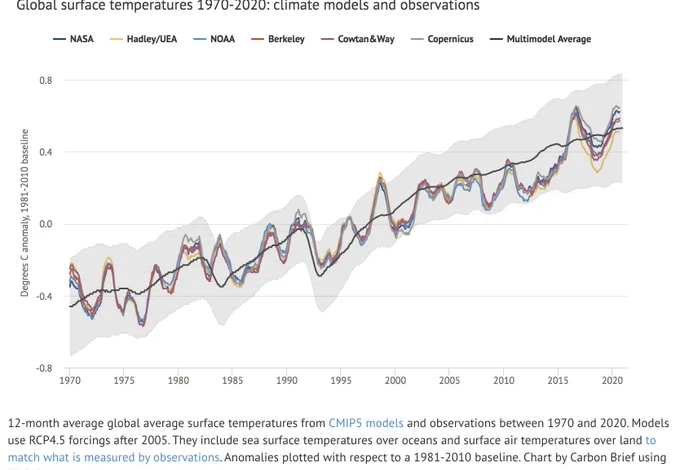
The most recent such analysis appears to be that shown for CMIP5 models in a tweet by Zeke Hausfather, reproduced in Figure 1. While the agreement between modeled and observed global mean surface temperature (GMST) warming over 1970–2020 shown in the Figure 1 looks impressive, it is perhaps unsurprising given that modelers knew when developing and tuning their models what the observed warming had been over most of this period.

Figure 1. Zeke Hausfather’s comparison of global surface temperature warming in CMIP5 climate models with observational records. Simulations based on the intermediate mitigation RCP4.5 scenario of global human influence on ERF through emissions of greenhouse gases, etc. were used to extend the CMIP5 Historical simulations beyond 2005.
It is well-known that climate models have a higher climate sensitivity than observations indicate. Figure 2 compares equilibrium climate sensitivity (ECS) diagnosed in CMIP5 models and in the latest generation, CMIP6, models with the corresponding observational estimate on the same basis in Lewis (2022) of 2.16°C and (likely range 1.75–2.7°C). Only one model has an ECS below the estimate in Lewis (2022), and most models have ECS values exceeding the upper bound of its likely range. CMIP6 models are generally even more sensitive than CMIP5 models, with half of them having ECS values above the top of the 2.5–4°C likely range given in the IPCC’s 2021 Sixth Assessment Report: The Physical Science Basis (AR6 WG1).

Figure 2. Red bars: equilibrium climate sensitivity in CMIP5 and CMIP6 models per Zelinka et al. (2020) Tables S1 & S2 estimated by the standard method (ordinary least squares regression over years 1–150 of abrupt4xCO2 simulations). Blue line and blue shaded band: best estimate and likely (17%-83% probability) range for ECS in Lewis (2022), derived from observational evidence over the ~150 year historical period but adjusted to correspond to that estimated using the aforementioned standard method for models.
So, how is it possible that Hausfather gets an apparently good match between models and observations in the period 1970-2020? Does it imply that the models correctly represent the effects of changes in “climate forcers”, such as the atmospheric concentration of greenhouse gases and aerosols, on GMST, and accordingly that their climate sensitivities are correct?
The key question is this. Matching by CMIP5 climate models, in aggregate, with observed GMST changes would only be evidence that models correctly represent the effects of changes in “climate forcers”, such as the atmospheric concentration of greenhouse gases and aerosols, on GMST if resulting changes in their combined strength in models matched best estimates of the actual changes in those forcers. The standard measure of strength of changes in climate forcers, in terms of their effect on GMST, is their “effective radiative forcing” (ERF), which measures the effect on global radiative flux at the top of the Earth’s atmosphere once it and the land surface have adjusted to the changes in climate forcers (see IPCC AR6 WG1 Chapter 7, section 7.3)
It is therefore important to compare changes in total ERF as diagnosed in CMIP5 models during their Historical and RCP4.5 scenario simulations over 1970–2020 with the current best estimates of their actual changes, which I will take to be those per IPCC AR6 WG1 Annex III, extended from 2019 to 2020 using the almost identical Climate Indicator Project ERF time series.
Historical and RCP4.5 ERF (referred to as “adjusted forcing”) in CMIP5 models was diagnosed in Forster at al. (2013), for the 20 models with the necessary data. I take the mean ERF for that ensemble of models[1] as representing the ERF in the CMIP5 models used in Figure 1.
Figure 3 compares the foregoing estimates of mean ERF in CMIP5 models with the best estimates given in IPCC AR6. Between the early 1980s and the late 2000s CMIP5 and AR6 ERF estimates agreed quite closely, but they diverged both before and (particularly) after that period. The main reason for their divergence since 2007 appears to be that aerosol ERF, which is negative, is now estimated to have become much smaller over that period than was projected under the RCP4.5 scenario. Updated estimates of aerosol ERF also appears likely to account for about half of their lesser divergence prior to 1983, with the remainder mainly attributable to differences in ERF changes for land use and various other forcing agents.

Figure 3. Effective radiative forcing (ERF) over 1970–2020 as estimated in CMIP5 models (mean across 19 models) and the best estimate given in the IPCC Sixth Assessment Scientific Report (AR6 WG1). The ERF values are relative to their 1860–79 means.
The IPCC AR6 best estimate of the actual ERF change between 1970 and 2020 is 2.53 Wm−2. The linear trend change over 1970–2020 given by ordinary least squares regression is 2.66 Wm−2, while the change between the means of the first and last decades in the period, scaled to the full 50 year period, is 2.59 Wm−2.
By comparison, the mean ERF change for CMIP5 models between 1970 and 2020 is 1.67 Wm−2. The linear trend change over 1970–2020 is 1.92 Wm−2, and the scaled change between the first to last decades’ means is 1.76 Wm−2.
It is evident that the AR6 estimate of the actual 1970–2020 ERF change is far greater than that in CMIP5 models. Based on the single years 1970 and 2020, the AR6-to-CMIP5 model ERF change ratio is 1.51. Based on linear trends that ratio is 1.39, while based on first and last decades’ means it is 1.46. The last of these measures is arguably the most reliable, since single year ERF estimates may be somewhat unrepresentative, and due to intermittent volcanism the ERF has large deviations from a linear relationship to time. As there is some uncertainty I will take the ratio as being in the range 1.4 to 1.5.
So, CMIP5 models matched the observed 1970–2020 warming trend, but the estimated actual change in ERF was 1.4 to 1.5 times greater than that in CMIP5 models. On the assumption that both the CMIP5 model ERF estimates and the IPCC AR6 best estimates of ERFs are accurate, it follows that:
- CMIP5 models are on average 1.4 to 1.5 times as sensitive as the real climate system was to greenhouse gas and other forcings over 1970–2020[2]; and
- CMIP5 models would have over-warmed by 40–50% if their ERF change over that period had been in line with reality.
It seems clear that the ERF change in CMIP5 models over 1970–2020 was substantially less than the IPCC AR6 best estimate, and that CMIP5 models substantially overestimated the sensitivity of the climate system during that period to changes in ERF. Moreover, the divergence is increasing: the ratio of AR6 to CMIP5 model ERF changes is slightly higher if the comparison is extended to 2022.
In conclusion, Maarten Keulemans’ claim that “a simple check of the models versus observed warming demonstrates that “climate models published since 1973 have generally been quite skillful predicting future warming” is false.
Contrary to the impression given by Zeke Hausfather’s rather misleading graph, CMIP5 models have not been at all skillful in predicting future warming; they have matched the illustrated 1970–2020 observed warming (which was past rather than future warming until the late 2000s, when CMIP5 models were still being tuned) due to their over-sensitivity being cancelled out by their use of ERF that increased much less than the IPCC’s latest best estimates of the actual ERF increase.
Nic Lewis 5 September 2023
[1] ex FGOALS-s2, the Historical and RCP simulations of which were subsequently withdrawn from the CMIP5 archive.
[2] There are some caveats to the conclusion that CMIP5 models were oversensitive by a factor of 1.4 to 1.5 times:
- the ensemble of CMIP5 models used in Forster et al. (2013) might not have been a representative subset of the entire set of CMIP5 model. However, there appears to be little or no evidence suggesting that is the case;
- despite their careful compilation, the AR6 best estimates of the evolution of ERF might be inaccurate;
- the CMIP5 model forcings derived by Forster et al. (2013) might be inaccurate. There are reasons to suspect that their method might produce ERF estimates that are up to about 10% lower than the methods used for IPCC AR6. However, Forster et al. present some evidence in favour of the accuracy of their method. Moreover, the agreement in Figure 2 between the CMIP5 and AR6 ERF time series between 1983 and 2007 (with divergences before and after then largely attributed to differences in particular forcing agents) is further evidence suggesting that the Forster et al. (2013) CMIP5 ERF estimates are fairly accurate; and
- due to the heat capacity of the ocean mixed layer, GMST is more closely related to average ERF exponentially-decayed over a few years rather than to ERF in the same year. Using exponentially-decayed ERFs would somewhat reduce the 1.4 low end estimate given above for the ratio of AR6 to CMIP5 model ERF 1970–2020 increase estimates, perhaps by ~10%.