Climate Hysteria Ramps Up in Antarctica but Recent Data Shows Sea Ice Levels Similar to 1966 • Watts Up With That?

The climate catastrophe caravan is on the move again with the alarmists whipping up fears over a supposed low rate of winter sea ice in Antarctica. In the Financial Times, science editor Clive Cookson reports that Antarctica “faces a catastrophic cascade of extreme environmental events… that will affect climate around the world”. Needless to say, there is no mention that Antarctica sea ice was at a record high in 2014, but curiously missing from all the hysteria is the fact that reanalysed early satellite data shows similar levels of winter ice in 1966. Even more curious is that minimal journalist sleuthing is required to uncover this information, since it is supplied by the frequently-consulted National Snow and Ice Data Centre (NSIDC).
Colorado-based NSIDC cited evidence that early Nimbus satellite data revealed winter sea ice extent of around 15 million square kilometres in 1966 “may have rivalled the very low level seen today”. There are some uncertainties in reanalysing such early satellite data, but the NSIDC says the findings are consistent with observations that Antarctica sea ice extent is “highly variable”. Last year, a group of American geographers and statisticians examined historical observations of Antarctica sea ice extent and found “statistically significant” positive trends since 1979. Furthermore, these trends across all four seasons compared with “statistically significant decreases” throughout much of the early and middle 20th Century.
Some of the FT guff came from a report commissioned by the Net Zero-promoting U.K. Government. Lead author Professor Martin Siegert from the University of Exeter says he is “staggered by the amount of change we’ve seen already in the past few years”. In fact we only have complete records of Antarctica sea ice since 1979, but it is more than likely that, like ice in the Arctic, it waxes and wanes on a natural cyclical basis. But like the coral on the Great Barrier Reef, the politically-inspired alarmists cry wolf when it falls, but move on to the next cherry pick when it recovers. Even though carbon dioxide is well mixed over the entire southern hemisphere, the small contribution made by humans is somehow held responsible, while cyclical changes offer the opportunity for Greta Thunberg-style contributions to climate science knowledge.
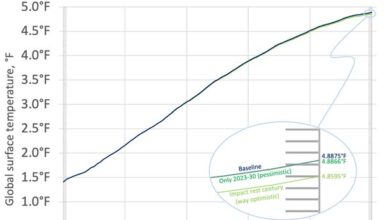
Antarctica was also in the news last month due to its leading role in promoting the “hottest day in 125,000 years” scare. The global claim of 62.6°F was the guesstimate product of a computer model from Climate Reanalyzer. It was heavily skewed by a ‘heatwave’ in Antarctica on July 3rd – 4th that saw temperatures soar in parts of the continent from -70°F to around -30°F. Without satellites, this localised rise would never have been detected in the past, calling into question the “hottest day” claims. Steve Milloy examines such claims every month. He argued that without the Antarctica spike, the global temperature would have been around 57.5°F, similar to the long-term figure.
As the Daily Sceptic has often noted in the past, Antarctica is a difficult place to create climate alarm. Over the last seven decades there has been little or no warming over large areas of the continent. According to a recent paper (Singh and Polvani), Antarctica sea ice has “modestly expanded” and warming has been “nearly non-existent” in this period. According to NASA figures, the ice loss is 0.0005% a year. Another recent paper found that ice shelves surrounding the continent grew in overall size by 0.4% in the years 2009-2019.

The above map from Singh and Polvani shows that all the warming in Antarctica is to be found in the west. It is to this area that eco warriors return with tales of collapsing ice shelves and glaciers. But it has always been known that the west side is an area of considerable volcanic activity. The full extent of this has recently been shown by scientists working at the GFZ German Research Centre for Geosciences. They provide scientific evidence that shows a “direct link” between recent western ice loss and geothermal heat flow. Furthermore, they state that it is common to attribute changes in ice dynamics and loss to atmospheric and oceanic influences. “However, recent studies suggest a direct link between the origin of ice streams and zones of increased heat flow,” it is noted.


This map compiled by the German scientists plots the known volcanoes (black triangles) under the ice in Antarctica, and highlights the geothermal heat flows arising from them. As can clearly be seen, the warming shown in the first graph correlates with the heat flows under the ice. The scientists say their work indicates a “direct connection” of deep lithospheric and surface processes. This is said to be in agreement with elevated geothermal heat found below the Thwaites and Pope glaciers.
That would be the Thwaites Glacier, otherwise known in the popular prints as the ‘Doomsday’ Glacier.
Chris Morrison is the Daily Sceptic’s Environment Editor.


