by Ross McKitrick
I have a new paper in the peer-reviewed journal Environmetrics discussing biases in the “optimal fingerprinting” method which climate scientists use to attribute climatic changes to greenhouse gas emissions. This is the third in my series of papers on flaws in standard fingerprinting methods: blog posts on the first two are here and here.
Climatologists use a statistical technique called Total Least Squares (TLS), also called orthogonal regression, in their fingerprinting models to fix a problem in ordinary regression methods that can lead to the influence of external forcings being understated. My new paper argues that in typical fingerprinting settings TLS overcorrects and imparts large upward biases, thus overstating the impact of GHG forcing.
While the topic touches on climatology, for the most part the details involve regression methods which is what empirical economists like me are trained to do. I teach regression in my econometrics courses and I have studied and used it all my career. I mention this because if anyone objects that I’m not a “climate scientist” my response is: you’re right, I’m an economist which is why I’m qualified to talk about this.
I have previously shown that when the optimal fingerprinting regression is misspecified by leaving out explanatory variables that should be in it, TLS is biased upwards (other authors have also proven this theoretically). In that study I noted that when anthropogenic and natural forcings (ANTH and NAT) are negatively correlated the positive TLS bias increases. My new paper focuses just on this issue since, in practice, climate model-generated ANTH and NAT forcing series are negatively correlated. I show that in this case, even if no explanatory variables have been omitted from the regression, TLS estimates of forcing coefficients are usually too large. Among other things, since TLS-estimated coefficients are plugged into carbon budget models, this will result in a carbon budget being biased too small.
Background
In 1999 climatologists Myles Allen and Simon Tett published a paper in Climate Dynamics in which they proposed a Generalized Least Squares or GLS regression model for detecting the effects of forcings on climate. The IPCC immediately embraced the Allen&Tett method and in the 2001 3rd Assessment Report hailed it as the way to show a causal link between greenhouse forcing and observed climate change. It’s been relied upon ever since by the “fingerprinting” community and the IPCC. In 2021 I published a Comment in Climate Dynamics showing that the Allen & Tett method has theoretical flaws and that the arguments supporting its claim to be a valid method were false. I provided a non-technical explainer through the Global Warming Policy Foundation website. Myles Allen made a brief reply, to which I responded and then economist Richard Tol provided further comments. The exchange is at the GWPF website. My comment was published by Climate Dynamics in summer 2021, has been accessed over 21,000 times and its Altmetric score remains in the top 1% of all scientific articles published since that date. Two and a half years later Allen and Tett have yet to submit a reply.
Note: I just saw that a paper by Chinese statisticians Hanyue Chen et al. partially responding to my critique was published by Climate Dynamics. This is weird. In fall 2021 Chen et al submitted the paper to Climate Dynamics and I was asked to provide one of the referee reports, which I did. The paper was rejected. Now it’s been published even though the handling editor confirmed it was rejected. I’ve queried Climate Dynamics to find out what’s going on and they are investigating.
One of the arguments against my critique was that the Allen and Tett paper had been superseded by Allen and Stott 2001. While that paper incorporated the same incorrect theory from Allen and Tett 1999, its refinement was to replace the GLS regression step with TLS as a solution to the problem that the climate model-generated ANTH and NAT “signals” are noisy estimates of the unobservable true signals. In a regression model if your explanatory variables have random errors in them, GLS yields coefficient estimates that tend to be biased low.
This problem is well-known in econometrics. Long before Allen and Stott 2001, econometricians had shown that a method called Instrumental Variables (IV) could remedy it and yield unbiased and consistent coefficient estimates. Allen and Stott didn’t mention IV; instead they proposed TLS and the entire climatology field simply followed their lead. But does TLS solve the problem?
No one has been able to prove that it does except under very restrictive assumptions and you can’t be sure if they hold or not. If they don’t hold, then TLS generates unreliable results, which is why researchers in other fields don’t like it. The problem is that TLS requires more information than the data set contains. This requires the researcher to make arbitrary assumptions to reduce the number of parameters needing to be estimated. The most common assumption is that the error variances are the same on the dependent and explanatory variables alike.
The typical application involves regressing a dependent “Y” variable on a bunch of explanatory “X” variables, and in the errors-in-variables case we assume the latter are unavailable. Instead we observe “W’s” which are noisy approximations to the X’s. Suppose we assume the variances of the errors on the X’s are all the same and equal S times the variance of the errors on the Y variable. If this turns out to be true, so S=1, and we happen to assume S=1, TLS can in some circumstances yield unbiased coefficients. But in general we don’t know if S=1, and if it doesn’t, TLS can go completely astray.
In the limited literature discussing properties of TLS estimators it is usually assumed that the explanatory variables are uncorrelated. As part of my work on the fingerprinting method I obtained a set of model-generated climate signals from CMIP5 models and I noticed that the ANTH and NAT signals are always negatively correlated (the average correlation coefficient is -0.6). I also noticed that the signals don’t have the same variances (which is a separate issue from the error terms not having the same variances).
The experiment
In my new paper I set up an artificial fingerprinting experiment in which I know the correct answer in advance and I can vary several parameters which affect the outcome: the error variance ratio S; the correlation between the W’s; and the relative variances of the X’s. I ran repeated experiments based in turn on the assumption that the true value of beta (the coefficient connecting GHG’s to observed climate change) is 0 or 1. Then I measured the biases that arise when using TLS and GLS (GLS in this case is equivalent to OLS, or ordinary least squares).
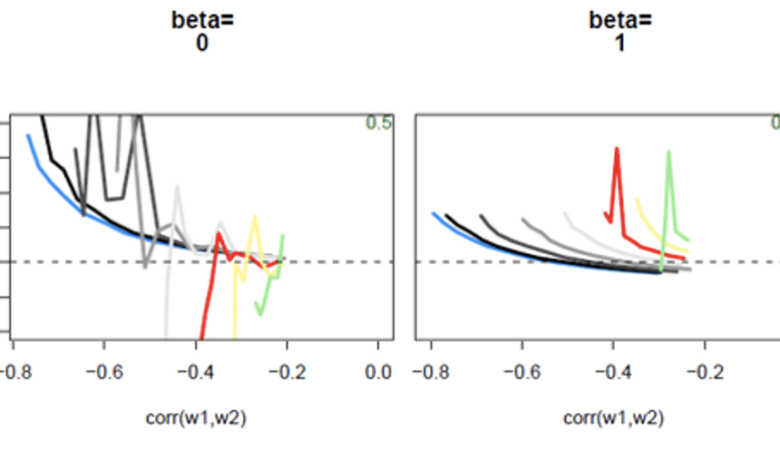
These graphs show the coefficient biases using OLS when the experiment is run on simulated X’s with average relative variances (see the paper for versions where the relative variances are lower or higher).

The left panel is the case when the true value of beta = 0 (which implies no influence of GHGs on climate) and the right is the case when true beta=1 (which implies the GHG influence is “detected” and the climate models are consistent with observations). The lines aren’t the same length because not all parameter combinations are theoretically possible. The horizontal axis measures the correlation between the observed signals, which in the data I’ve seen is always less than -0.2. The vertical axis measures the bias in the fingerprinting coefficient estimate. The colour coding refers to the assumed value of S. Blue is S=0, which is the situation in which the X’s are measured without error so OLS is unbiased, which is why the blue line tracks the horizontal (zero bias) axis. From black to grey corresponds to S rising from 0 to just under 1, and red corresponds to S=1. Yellow and green correspond to S >1.
As you can see, if true beta=0, OLS is unbiased; but if beta = 1 or any other positive value, OLS is biased downward as expected. However the bias goes to zero as S goes to 0. In practice, you can shrink S by using averages of multiple ensemble runs.
Here are the biases for TLS in the same experiments:
 There are some notable differences. First, the biases are usually large and positive, and they don’t necessarily go away even if S=0 (or S=1). If the true value of beta =1, then there are cases in which the TLS coefficient is unbiased. But how would you know if you are in that situation? You’d need to know what S is, and what the true value of beta is. But of course you don’t (if you did, you wouldn’t need to run the regression!)
What this means is that if an optimal fingerprinting regression yields a large positive coefficient on the ANTH signal this might mean GHG’s affect the climate, or it might mean that they don’t (the true value of beta=0) and TLS is simply biased. The researcher cannot tell which is the case just by looking at the regression results. In the paper I explain some diagnostics that help indicate if TLS can be used, but ultimately relying on TLS requires assuming you are in a situation in which TLS is reliable.
The results are particularly interesting when the true value of beta=0. A fingerprinting, or “signal detection” test starts by assuming beta=0 then constructing a t-statistic using the estimated coefficients. OLS and GLS are fine for this since if beta=0 the coefficient estimates are unbiased. But if beta=0 a t-statistic constructed using the TLS coefficient can be severely biased. The only cases in which TLS is reliably unbiased occur when beta is not zero. But you can’t run a test of beta=0 that depends on the assumption that beta is not zero. Any such test is spurious and meaningless.
Which means that the past 20 years worth of “signal detection” claims are likely meaningless unless steps were taken in the original articles to prove the suitability of TLS or verify its results with another nonbiased estimator.
I was unsuccessful in getting this paper published in the two climate science journals to which I submitted it. In both cases the point on which the paper was rejected was a (climatologist) referee insisting S is known in fingerprinting applications and always equals 1/root(n) where n is the number of runs in an ensemble mean. But S only takes that value if, for each ensemble member, S is assumed to equal 1. One reviewer conceded the possibility that S might be unknown but pointed out that it’s long been known TLS is unreliable in that case and I haven’t provided a solution to the problem.
In my submission to Environmetrics I provided the referee comments that had led to its rejection in climate journals and explained how I expanded the text to state why it is not appropriate to assume S=1. I also asked that at least one reviewer be a statistician, and as it turned out both were. One of them, after noting that statisticians and econometricians don’t like TLS, added:
“it seems to me that the target audience of the paper are practitioners using TLS quite acritically for climatological applications. How large is this community and how influential are conclusions drawn on the basis of TLS, say in the scientific debate concerning attribution?”
In my reply I did my best to explain its influence on the climatology field. I didn’t add, but could have, that 20 years’ worth of applications of TLS are ultimately what brought 100,000 bigwigs to Dubai for COP28 to demand the phaseout of the world’s best energy sources based on estimates of the role of anthropogenic forcings on the climate that are likely heavily overstated. Based on the political impact and economic consequences of its application, TLS is one of the most influential statistical methodologies in the world, despite experts viewing it as highly unreliable compared to readily available alternatives like IV.
Another reviewer said:
“TLS seems to generate always poor performances compared to the OLS. Nonetheless, TLS seems to be the ‘standard’ in fingerprint applications… why is the TLS so popular in physics-related applications?”
Good question! My guess is because it keeps generating answers that climatologists like and they have no incentive to come to terms with its weaknesses. But you don’t have to step far outside climatology to find genuine bewilderment that people use it instead of IV.
Conclusion
For more than 20 years climate scientists—virtually alone among scientific disciplines—have used TLS to estimate anthropogenic GHG signal coefficients despite its tendency to be unreliable unless some strong assumptions hold that in practice are unlikely to be true. Under conditions which easily arise in optimal fingerprinting, TLS yields estimates with large positive biases. Thus any study that has used TLS for optimal fingerprinting without verifying that it is appropriate in the specific data context has likely overstated the result.
In my paper I discuss how a researcher might go about trying to figure out whether TLS is justified in a specific application, but it’s not always possible. In many cases it would be better to use OLS even though it’s known to be biased downward. The problem is that TLS typically has even bigger biases in the opposite direction and there is no sure way of knowing how bad they are. These biases carry over to the topic of “carbon budgets” which are now being cited by courts in climate litigation including here in Canada. TLS-derived signal coefficients yield systematically underestimated carbon budgets.
The IV estimation method has been known at least since the 1960s to be asymptotically unbiased in the errors-in-variables case, yet climatologists don’t use it. So the predictable next question is why haven’t I done a fingerprinting regression using IV methods? I have, but it will be a while before I get the results written up and in the meantime the technique is widely known so anyone who wants to can try it and see what happens.