Introduction
Every summer BP publish their statistical review of world energy.
One element of their comprehensive set of spreadsheets is a table of CO2 emissions country by country since 1965. For the purposes of this post, the CO2 emissions data provided by BP here is assumed to be valid. This post reviews the 2022 update to the BP data.
The 2022 dataset accounts for the 2020 effect of the Covid-19 epidemic, the CO2 emissions resulting in the aftermath of the epidemic, its impact on Global economic activity and the outcome for the recovery of Man-made CO2 emissions in 2021.

The progress of the proportions of CO2 emissions since 1965 is shown above, with the Developed world now being responsible for about 37% of Man-made CO2 emissions as opposed to as much as 86% back in 1965.
The comprehensive BP country by country data is aggregated into seven Nation groups according to their nominal state of development and attitudes towards controlling CO2 emissions, as follows:
- Developed
- USA
- JP CIS CA AU
- Europe inc UK TK UA ..
- Nominally Developing
- KR IR ZA MX SA BR ID TW
- China HK
- India
- Rest of World (~160 Nations)
For an earlier post reporting the status of Man-made CO2 emissions as of 2020, see:
Representation by Region
The pie diagram above shows the proportion of CO2 emissions as of the end of 2021. These 2021 data are set out in tabular form below.
This analysis divides the world’s nations into seven roughly equivalent logical groups with distinct attitudes to their CO2 emissions:
Developed nations: population ~1.3 billion, (~17%) – ~37% CO2 emissions.
United States of America: population ~330m, ~13.9% of global CO2 emissions.
President Biden has negated many of Trump’s climate initiatives, including the USA rejoining support for the Paris Climate accord. The actions of the Trump presidency had established USA energy independence for the first time in several decades. In the USA, simply by exploiting shale gas as opposed to Coal for electricity generation, has already reduced its annual CO2 emissions by some by ~1,000,000,000 tonnes, ie by one third, since 2005. That market driven initiative has already had a greater CO2 emission reduction effect than the entire Kyoto protocol and the Paris Climate Accord.
Japan, the former Soviet Union, (CIS), Canada and Australia, (JP CIS CA AU): population ~356m, ~12.1% of global CO2 emissions.
These are nominally developed nations with some ambivalence towards controls on CO2 emissions and not necessarily adhering to the Paris Climate Accord.
Europe including the UK, Turkey and the Ukraine: population ~650m, ~11.2% of global CO2 emissions.
This reassessment including Turkey and the Ukraine adds ~120 million to the wider European population with a resulting lowering of the overall CO2 emissions/head. Currently European governments are still largely committed to action to combat Global Warming; they have generally been enthusiastic supporters of the Paris Climate Accord, but the context is changing rapidly, including:
- since February 2022 the war in Ukraine has suddenly made Western nations realise that their immediate energy security in the is much more important than any Green agenda to save the World from possible warming by the end of the century and that their Energy Security and injudicious dependence of Russian energy sources has enabled that Energy Security as a weapon against their economies. But, after 30 years of unrelenting Green propaganda the Green agenda is still well established in the thinking of European Governments.
- European peoples will come to understand the substantial changes to their lifestyles, personal economies and freedoms that are demanded by their governments’ to pursue the Net Zero / Green agenda and voters may be losing enthusiasm as they understand the real life implications of the imposed policies.
- long-term policies providing generous subsidy support for “Renewables” as opposed to Conventional power generation have been pursued, particularly in Germany and the UK.
- the preferential support of “Renewable” technologies has fruitlessly undermined investment in conventional reliable power generation to the extent that there is now real doubt about the ability of European power grids to provide a consistent service 24/7.
- the subsidy support has meant that ~ 25% is aded to electricity bills go to support the “Renewable” technologies in the UK and elsewhere. With escalating power bills European are at last realising that much of their increased costs are for the support of “Renewables” and progressively these expenditures will meet increasing resistance as the level of waste and the unreliability they represent becomes appreciated.
- the Yellow Vests reaction in France was an immediate and violent reaction to the increase of fuel taxes on grounds of combatting climate change. The fuel price rises in 2022 are much more drastic than those that induced the “Yellow Vest” reaction.
- policies based on climate concerns are irrelevant to improving well-being in the Developing World, which has no interest for actions that would restrain their continuing development and well-being using their indigenous fossil fuels.
Nominally Developing nations: population ~6.6 billion, (84.6%) – ~63% CO2 emissions.
South Korea, Iran, South Africa, Mexico, Saudi Arabia, Brazil, Indonesia and Taiwan, (KR IR ZA MX SA BR ID TW): population ~910m, 12.0% of Global CO2 emissions.
These are the more advanced developing nations, they are still growing rapidly, with minimal commitments under the Paris Climate accord.
China and Hong Kong: population 1,439m, ~31.2% of Global CO2 emissions.
China is still developing very rapidly, in-spite of the set back induced by the Covid 19 epidemic. Even though China’s CO2 emissions/head have exceeded the level in Europe, China is still considered as a nominally “developing” Nation China and has no effective commitments under the Paris Climate Accord. China is responsible for the continuing development of its own Coal-Fired installations and multiple Coal-fired installations in the Third World. Its actions are not restricted by the Paris Climate Accord. China has made gestures towards “Renewable Energy”, (but mainly for marketing reasons), as China benefits substantially from Solar PV and other “Renewables” manufacture. At the same time, China is advancing the development of new generations of Nuclear power
India: population 1,339m: ~7.5% of Global CO2 emissions.
India is developing rapidly from a low base with no virtually commitments under the Paris Climate Accord. India is continuing the rapid development of its own Coal-Fired installations. Although India makes gestures towards “Renewable Energy”, its actions reject the Paris Climate Accord. At the same time, India is advancing the development of new generations of Nuclear power.
Rest of World (~160 Nations), population 2,865m – ~36%: 15.2% CO2 emissions.
The remainder of the underdeveloped world like India is developing rapidly from a low base of ~1.5 tonnes CO2/head. These nations have no real commitments under the Paris Climate Accord, other than their anticipated receipt of “Climate Funds” from Developed nations. To support their growth and development all these nations require real dispatchable electrical power and refuse to be to be fobbed off with unreliable “Renewables” by Western Nations.
As long ago as 2010 Professor Richard Muller made the dilemma for all those who hope to control global warming by reducing the CO2 emissions of Western Nations, very clear. In essence he said:
“the Developing World is not joining-in with CO2 emission reductions nor should it have any intention of doing so. The failure of worldwide action negates the unilateral action of any individual Western Nation and the West will become more marginal and increasingly irrelevant”.
By 2021 CO2 emissions from the Developing world were ~63% of the global total. India, China and the underdeveloped world will certainly be continuing to promote their own development with the ambition to progress to comparable levels of well-being to Western Nations.
Contrasting the Developed and Developing worlds
Developing world emissions overtook Developed world CO2 emissions in 2005 and they have been growing ever since. CO2 emissions from the Developing world are now ~10,000 million tonnes higher than the Developed world’s emissions. It is to be expected that Developing world CO2 emissions to continue to grow unabated.
However the Covid-19 effect has meant that in 2020 overall:
- in 2020 the Global Man-made CO2 emissions fell by ~2,017 million tonnes to 32,284 million tonnes with CO2 emissions / head reduced from 4.43 tonnes to 4.14 tonnes on average.
- the Developed world reduced its Man-made CO2 emissions by ~1,324 million tonnes (~11%),with CO2 emissions / head reduced from 10.56 tonnes to 9.35 tonnes on average.
- the Developing world only reduced its Man-made CO2 emissions by ~697 million tonnes, (~2%) with CO2 emissions / head reduced from 3.30 tonnes to 3.19 tonnes on average.
- in 2021 the recovery from Covid-19 Global CO2 emissions immediately grew by ~1,800 million tonnes in with a Global uptick of CO2 emissions to 4.35 tonnes/head.
Up until 2020, CO2 emissions in the Developing world were accelerating as the quality of lives for people progressively improved. That growth of CO2 emissions is likely to escalate in future as the Chinese develop Coal-fired power stations both at home and via the “Belt and Road programme” throughout the developing world. Even so, at present at least ~1.12 billion people, ~15% of the global population, still have no access to reliable electric power.
Since 1990 CO2 emissions from the Developed world have decreased, whereas the Developing world has shown a fourfold increase since 1985. This differential has arisen as a result of:
- to the off-shoring from the West of major CO2 emitting industries to parts of the world that have less rigorous environmental standards and/or who are less concerned about CO2 emissions.
- the growing use of Coal-firing for electricity generation, the most economic option for the Developing world, particularly as supported by Chinese technology exports via its “Belt and Road Programme”.
- the use of Fracked natural gas for electricity generation as opposed to Coal-firing as in the USA.
- the earlier 1990s “dash for gas” policy in the UK.
- the long-term dependence on Nuclear power, ~80% of power generation as in France.
Having been relatively stable for the previous 5 years, as a result of the Covid-19 effect overall Global CO2 emissions fell in 2020 by ~6.0%. The Developing world has reduced CO2 emissions as a result of Covid-19 but the effect was only marginal when compared to the reductions in the Developed world. In 2021 those reduced CO2 emissions were re-instated in large part.
On the other hand, Weather-Dependent “Renewables”, have made very little contribution to CO2 emissions reduction, if at all. When looked at in the round, from their manufacture to demolition, they are hardly CO2 emissions nor energy neutral over their service life. In effect “Renewables” are parasitic on conventional Generation for their existence.
The use of Biomass for electricity generation, although considered to be “carbon neutral by policy” in Western thinking, actually increases the immediate release of CO2 to the atmosphere, producing about twice as much CO2 as Coal-firing and almost 4 times more than Gas-firing for equivalent power generation. It has been assessed that the whole exercise to substitute Coal firing by Biomass at the UK Drax power plant has negated all the possible CO2 savings that have been made from the extensive installations of Wind and Solar power in the UK. The use of Biomass in Germany is equally self defeating. In addition the use of Biomass is hugely destructive of natural habitats and its use for energy substituting for food products substantially increases the costs of food Worldwide.
Recent CO2 emissions changes and the Covid-19 effects
The radical changes indicating recent CO2 emissions reduction from Covid-19 can be seen below.
It is clear above that the major reductions in CO2 emissions that arose from Covid-19 in the Developed world, particularly in Europe and the USA have been largely reinstated in 2021.
Global CO2 emissions had previously plateaued, but in the period 2016-2019 they had a significant uplift. Unsurprisingly the emissions growth has mainly occurred in the developing nation groups India and the Rest of World as their quality of life has improved progressively. After a fall in 2015 – 2016 in 2017 – 2020 the was an uplift in Chinese emissions. China was the only territory to increase its Man-made CO2 emissions in 2020 in spite of the Covid-19 effect.
With increasing installation of Coal-Fired generation throughout the developing world it is now inevitable that Global CO2 emissions will continue to grow significantly, entirely negating the objectives of the Paris Climate accord.
https://www.thegwpf.com/china-building-300-new-coal-power-plants-around-the-world/
CO2 emissions / head
Possibly more significant than the total CO2 emissions output is the comparison of the CO2 emissions / head for the various Nation groups. This measure represents the level of development and access to electrical power of various Nations.
The USA has already reduced its CO2 emissions/head by 1/3 since 2000. The reduction has arisen by replacing Coal-firing with shale gas for electricity generation: Gas-firing produces about 1/2 the CO2 emissions of Coal-firing. Post Covid-19 in 2021 the USA CO2 emissions/head have been partially restored.
The combination of Russia, Japan, Canada and Australia have hardly grown their emissions/head since 2005 but saw a reduction in CO2 emissions as a result of Covid-19. In 2021 those CO2 emissions have been largely restored.
Europe with active legal measures had reduced emissions until ~2013. The reassignment of the European sphere of influence in this post means that overall the CO2 emission have fallen to 5.84 tonnes/head. Much of that downward trend is largely attributed to the decline of European economies and the displacement of industrial processes to countries with laxer environmental regimes. The effect of Covid-19 was particularly acute in Europe.
In 2003 China overtook the world-wide average for CO2 emissions / head and surpassed the rapidly developing nations. China’s emissions / head have increased in 2021 to ~7.36 tonnes / head. With the Covid-19 effect in Europe CO2 emission/head have reduced to 5.84 tonnes/head whereas China has now surpassed the whole of Europe at ~7.36 tonnes / head.
India’s CO2 emissions have grown by 4.7 times since 1965 and are still accelerating. That emissions rate is likely to grow continuously with increased Indian use of coal for electricity generation. India and the bulk of the underdeveloped nations, (~55% of the world’s population), still remain at a low level of CO2 emissions levels/head now of ~1.85 – 1.54 tonnes/head, this level is about 1/7 of the level of the USA and about 1/3 of the level in China and Europe. These under-developed Nations still have poor access to reliable power and consequently very substantial potential for further CO2 emissions growth.
The CO2 emission reduction has not been achieved by the introduction of Weather-Dependent Renewables, which will always require full dispatchable back-up to compensate for their intermittent unreliability. In addition their raw material requirements, manufacture, installation, etc. will always continue to need substantial fossil fuel input. Their performance measured by Energy Return on Energy Invested, EROI means that Weather-Dependent Renewables will always be Energy parasitic on conventional power generation.
As part of its Cold War aggression towards Western economies, Russia has been actively involved in backing anti-fracking campaigns throughout Europe and in the USA via its support of various NGO groups and its influence on Governments. Originally this has been an obvious commercial policy to protect the large Gasprom markets for Russian Gas in Europe.
The policy of promoting dependence on Russia energy exports has now been now weaponised giving Russia energy stranglehold on EU (27) Nations. With the ongoing war in the Ukraine, the injudicious policies of allowing energy dependence on Russia, particularly of the German economy has now become painfully evident.
The export of Fracked gas from the USA to Europe and the possibility of establishing indigenous fracking of the available resources might break the stranglehold, but a complete reversal of European / Western Green policies will be necessary to achieve that.
CO2 emissions / head for India and the Rest of the World’s Underdeveloped nations (~53% of the world population) remains low at ~1.7 tonnes / head, (still ~40% of the Global average) meaning that their state of serious human deprivation and underdevelopment is continuing, even though it is progressively being rectified. India’s CO2 emissions 2020 – 2021 grew by a further 272 million tonnes. India has some 450 new Coal-fired generation plants currently under development so this growth in CO2 emissions will continue.
China, (still nominally considered here as a “Developing Nation”), according to its un-concerned attitude to the Paris climate accord, showed domestic CO2 emission growth of 5.4%, 545 million tonnes in 2021. However, China has also been promoting the use of Coal-firing for electricity generation both domestically, (300 – 500 new Coal-fired plants) and across the Developing world with some 300 new Coal-fired generating plants currently in the pipeline.
https://economics21.org/inconvenient-realities-new-energy-economy
European CO2 Emissions / head
When the environmentally active / Green aware European Nations are compared with Chinese and USA CO2 emissions/head, the following picture arises.
In 2020 average European CO2 emissions/head, post Covid-19, (5.84 tonnes/head), are now well exceeded by China, (7.36 tonnes/head) and this closely approaches Germany the highest CO2 emitter in Europe. European CO2 emissions overall fell slightly in 2020, notably in Germany and remarkably further in France. The UK has seen a significant drop in CO2 emissions reaching 4.77 tonnes/head in 2021. The UK is now close to the Global average for CO2 emissions / head.
At 3.58 tonnes/head, post COVID France, now has the lowest CO2 emission rates in the developed world, and is at 15% below the Global average. This is entirely due to the long-term French commitments to electricity generation by Nuclear energy. The French example shows that, were it desirable, comparatively low CO2 emissions can be achieved in a developed country by using Nuclear energy: this must question the logic of Green attitudes in opposing of Nuclear power.
If CO2 emissions really were a concern to arrest Catastrophic Anthropogenic Global Warming / Man-made Climate Change, these results, show starkly the very real advantage of using Nuclear power for electricity generation. President Macron’s earlier intentions were to reduce French Nuclear generation from ~75% to 50%: this would have been particularly anachronistic but he now seems to have decided to reverse that decision. Green attitudes in the French government had thus threatened to destroy this unique low-carbon French national asset, which also makes other European Nations, particularly the UK (~9% power 2021 supply imported) and Germany (~13% of 2021 power supply imported) largely dependent on these French power exports.
At 7.70 tonnes/head, Germany virtually is alone in Europe, it now exceeds the CO2 emissions/head level of China by only 10% and is well above the European average. The long-term policy of “die Energiewende” has resulted in Germany having the world’s highest power costs, (save for Denmark).
Germany, one of the largest CO2 emitters in Europe, has emissions/head about twice the worldwide average but that is now only ~10% higher than China. Germany’s emissions have increased recently because they are now burning large quantities of brown coal to compensate for the “irrational” policy closure of almost all of their nuclear generating capacity: irrationally that emotionally based policy still seems to stand in Germany in spite of Russia now weaponising the restriction of German energy supplies.
Such action should have been impossible in the premier engineering environment of Germany but following the Fukushima disaster, the German government position was to rapidly eliminate its own nuclear power. Nonetheless, this irrational and emotional reaction was made in a country with no earthquake risk and no chance of damaging tsunamis.
In 2021 the UK was responsible for just 1.0%, (338 million tonnes) of the 2021 total 33,884 million tonnes of global CO2 emissions. The UK government has now committed to reduce CO2 emissions to Net Zero by 2050 at an estimated cost well in excess of some £1,000,000,000,000. Any attempt to reduce these insignificant UK CO2 emissions at such enormous cost would therefore seem entirely fatuous in the context of inevitable CO2 emissions growth worldwide and the energy crisis induced by the war in Ukraine.
The futility of Western de-carbonisation
Although there was a momentary hiatus as a result of Covid-19, it is clear that CO2 emissions growth is continuing in the Developing World and that growth can be expected to continue virtually indefinitely in future. So, the futility of the one-sided expenditure of vast resources on Green activities in Europe and throughout the Western world is clear.
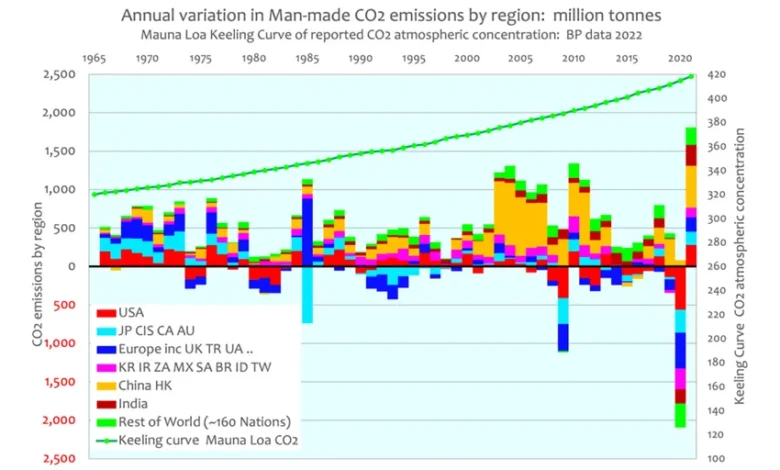
When the gross changes in Global CO2 emissions over the past 30 years are set against the measured of Global CO2 concentration records from Mauna Loa, it can be seen that these major changes in Man-made CO2 emissions have not caused any appreciable inflection in the Keeling CO2 concentration curve.
But the self-harming actions of the Western Governments in response to Alarmist Green thinking are causing gross risks to Western energy security by the imposition of unreliable and intermittent Weather-Dependent “Renewables”. These policies will result in substantially increased costs for all energy users and in addition they will severely damage the economies of all Western Nations.
The effective elimination of Fracking as a technique for fossil fuel recovery in Western Europe is a self-inflicted harm caused by “Green Virtue Signalling” and it has been to sole the benefit of the energy warfare of Russia and China in the continuation of “a less than covert Cold War”.
The resulting excess expenditures across Europe to date compared to using Gas-firing for power generation can be estimated as:
- Weather-Dependent “Renewables” 385GW
- Weather-Dependent power output 2021 69GW
- in wasted excess capital costs ~623 € billion
- in wasted excess long-term costs over a 40-year service life ~1,l825 € billion.
This is the scale of direct fiscal damage that has been caused by the obstruction of Fracking throughout Europe, originally just to benefit of Russian Gas exports and now to give Russia an Energy Security weapon with which to threaten European civilisation.
https://thecritic.co.uk/issues/december-2019/the-plot-against-fracking/
https://edmhdotme.wordpress.com/quantifying-futility-2020-data/embed/#?secret=77UGZ7lvRt#?secret=YijIuJn2Da
Conclusions
The recently released data from BP shows:
- the recent 2020 down turn in CO2 emissions arising mainly in the Western world as a result of Covid-19 is already close to being wholly reinstated in 2021.
- with the continuing growth of Coal-firing in China, India and throughout the developing world Man-made CO2 emissions are now continuing to advance.
- Man-made CO2 emissions can be expected to grow strongly in future, whatever actions may be taken in the West curtail their own CO2 emissions.
- even with the marked recent negative and positive variations in Man-made CO2 emissions in the last two years their impact cannot be discerned as any visible perturbation of the standard atmospheric CO2 measurements in the Mauna Loa Keeling curve.
- Western European nations have injudiciously allowed the continuing access to fossil fuels from Russia to be weaponised against them: this will be a particularly acute problem in the coming Winter of 2022 – 2023. This gross policy error will substantially damage the Western economies.