by Fritz Vahrenholt and Rolf Dubal
Warming over the past 20 years has been instrumental in the change in clouds.
We have been investigating the Earth’s radiation balance for the past 20 years in a peer-reviewed publication in “Atmosphere”. The net radiant flux, that is, the difference between solar radiation and long- and short-wave radiation, determines the change in the energy content of the climate system. If it is positive, the Earth is warming; If it is negative, it means cooling. The satellite-based CERES project operated by NASA has provided such radiation data for two decades now, as well as data on the evolution of the cloud cover with spatial and temporal resolution. These data are determined both in terms of approximate heights. 20 km (TOA = “Top of the Atmosphere”), and is also related to the surface of the Earth.
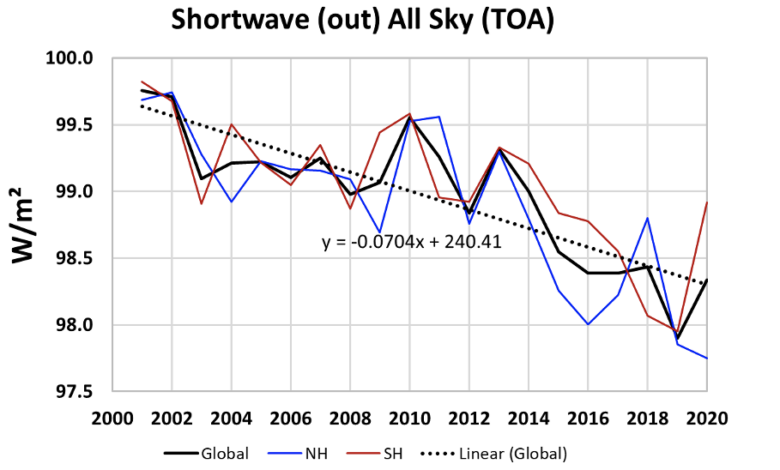
Our new publication”Variation of radiant energy flux from 2001 to 2020 ″ brought to light a surprising result for climate science: the warming of the Earth over the past 20 years is mainly due to the higher permeability of clouds to short-wave solar radiation. Shortwave radiation was sharply reduced during this period (see figure), equally in the Northern and Southern hemispheres (NH and SH). With solar radiation being roughly constant, this means more shortwave radiation has reached the Earth’s surface, contributing to warming. Longwave reverse radiation (so-called greenhouse effect) contributes to warming only to a lesser extent. It is even largely offset by the increasing permeability of clouds to the long-wave radiation emitted by the Earth. The authors came to this unequivocal conclusion after evaluating the CERES radiation data.

NASA researcher Norman Loeb and collaborators [link]as well as Finnish researcher Antero Ollila [link], recently showed that shortwave solar irradiance increased from 2005 to 2019 due to a decrease in low clouds. Our latest publication examined TOA and terrestrial radiation fluxes over the entire period and related them to changes in cloud cover. The net energy flow was positive throughout the period, increasing from 0.6 W/m² to 0.75 W/m² between 2001 and 2020. The 20-year average was 0.8 W/m². The bridge plot shows the drivers of this change, and they are clearly in the shortwave radiation in the cloud regions, which cover about two-thirds of the Earth’s surface (SW Cloud Area, +1.27 W/ m²).

This is in contrast to the IPCC’s assumption in its most recent report that the warming caused by an increase in return long-wave radiation is solely due to the anthropogenic greenhouse effect. The IPCC attributes 100% of the warming to this effect and proves this with model calculations. However, analysis of measured data by Dübal and Vahrenholt showed that warming due to shortwave radiation decreased by 1.4 W/m² and long wave radiation – 1.1 W/m² increased mainly due to the cloud effect. cloud.
We also examined the effect of this radiative excess on the heat capacity of the climate system over a longer period of time since 1750, where “enthalpy” means the sum of heat, work, and latent heat. , ie heat of water evaporation, heat of melting. of ice, changes in the energy of the biosphere (plant growth), etc. Since about 90% of this enthalpy is still heat in the oceans, conclusions about enthalpy growth can also be drawn. by looking at the ocean’s long-term heat content (OHC). There was good agreement between these two independent datasets for the period 2001-2020, and the existing OHC data were evaluated over a longer, earlier time period to provide an overall picture. This suggests that warming since 1750 has been intermittent, but has occurred in heating waves, designated A, B and C, during each of which a high net radiant flux (0.7) to 0.8 W/m²) operate for 20-30 years, alternating with lighter periods. The onset of these heat waves coincided with a change in the sign of another known natural climate factor, the AMO (Atlantic Multi-Local Oscillation). The key question as to whether the current C heating period will end soon as in cases A and B, or will it continue, can only be decided on the basis of longer observations and therefore remains to be seen. left open.

To investigate the onset of phase C around 2000, other data sets were used, including the EUMETSAT cloudiness measurements, a European satellite project. It can be seen here that the onset of the C phase was accompanied by a decrease in cloudiness, which coincided with the aforementioned change in the AMO sign. From the irradiance measurements, it can be inferred that less than 2% cloud cover means about 0.5 W/m² more net radiant flux, which could explain most of the zero. 8 W/m² mentioned above.

This result is also corroborated by the analysis of the radiative balance near the surface. Here an increase in the greenhouse effect is observed, which correlates well with increases in water vapor and CO2 of the greenhouse gases, but only for regions without clouds (“clear sky”). However, this correlation does not apply to areas of cloud cover, which cover about two-thirds of the earth’s area.
We can demonstrate a greenhouse gas increase of the sum of all greenhouse gases (water vapor, CO2, etc.) under “Clear Sky” conditions with an increase of 1.2 W/m² over the past 20 years . However, this increase is overcompensated on an area-weighted basis by the irradiance increase of longwave radiation in cloud regions (“Cloudy Areas”) by up to -1.48 W/m² .
The 20-year period is still too short to accurately determine whether the current heating period is a temporary or permanent development. In the former case, the climate projections would have to be fundamentally revised. The physical mechanism leading to cloud thinning is discussed differently in the literature. Vahrenholt: “Cloud changes can be caused by a reduction in aerosols, by warming of the atmosphere from natural causes (e.g. AMO or PDO), by anthropogenic warming by CO2, or by a combination of these individual factors. One thing can be said, however: that the warming over the past 20 years has been caused more by cloud changes than by the classical greenhouse effect.