by Andy West
A single social predictor for international attitudes to climate change renders the current literature obsolete.
There is a long-standing and extensive literature that searches for ‘social predictors’ of public attitudes to climate change: the social or demographic factors – such as political attitude, age, education or relative prosperity, among many other candidates – that can explain how people view the issue. As predictive power is sought at the national as well as the individual level, further candidate predictors might include, for example, the relative civil liberties of a nation or its exposure to climate impacts.
The Holy Grail of this field is a single variable that is potent enough to explain, in broad terms, public attitudes to climate change, such as whether it is man-made, whether they’ll be harmed by it, or what priority they might give to fighting it (relative to other issues or threats). In other words, a variable that can predict a large part of the level of such attitudes in a population; if not at the dizzy heights of 50%, then maybe 30%, say, where this is at least the largest single factor among (perhaps many) others. The general idea behind this search, sometimes made explicit, is that knowledge of the drivers of attitudes would enable publics to be nudged in the ‘right’ direction of supporting Net Zero policies.
However, outside the USA1 the Holy Grail has slipped further and further away. A dozen years or more back, the search still featured attempts to find a single powerful predictor. But as the years passed without success, efforts moved to multivariate analysis; it was hoped that three or four variables might yield greater predictive power when considered together. Unfortunately, these efforts did not deliver dramatic improvements, and also introduced disagreements about which groupings of variables were best. So, more and more variables were then pulled into the search, in a seemingly desperate attempt to find the missing magic that would make prediction possible. This required ever more complex models and increasingly sophisticated statistics.
As a result, the field now features convoluted webs of related variables, some of which themselves are high-level concepts such as ‘New ecological paradigm’, or ‘Class’ (engaged, pessimistic, indifferent, doubtful). A higher-level concept at the national level is for example ‘national attitudes to environmental care’. Ridiculous variables have been dragged in too, such as the number of climate scientists residing in each nation!
Figure 1, taken from the meta-study of Ruiz et al (2019), is representative of the current predictor literature. The details are not important; the takeaway is that overall it depicts a fiendish complexity.

Figure 1: Public attitudes to climate change: a typical model from the literature.
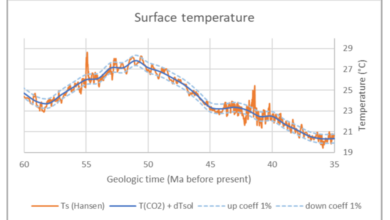
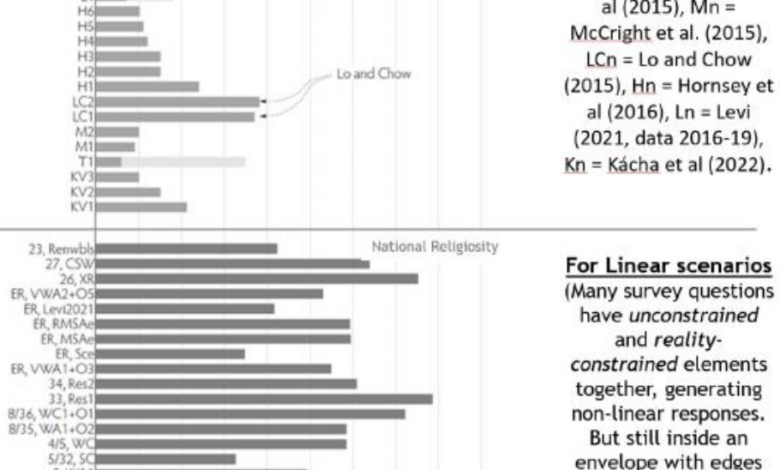
The huge increase over the years in the perceived complexity of what drives attitudes to climate change has hardly improved, if at all, the power of any group of predictors (while single predictors are much less emphasised). Predictor values are mostly still poor (<20%) or very poor (<10%). The top half of Figure 2 shows a range of typical predictor values from the literature; some are older, some newer, some are from simpler models and some more complex ones, some of them concern individual attitudes while others are national in scope. However, ultimately they all arise from a chronic lack of underlying theory about the attitudes that are being examined. Only one paper features a predictor that exceeds the 30% level.2

Figure 2: Power of predictors in the literature (top) and using cultural causation (bottom)
This situation has now changed dramatically. As my book The Grip of Culture sets out, there is an underlying theory explaining international public attitudes to climate change, which leads to an outstanding social predictor at the national level. In other words, there is a Holy Grail: a single social variable that across nations predicts a high proportion of the public attitudes to climate change (33–87% depending upon the attitude), and across a wide range of attitudes too; it is national religiosity.
Figure 3 represents the theory in the same manner as the example diagram from the literature, and the bottom half of Figure 2 shows the dramatically increased predictive power from this far more straightforward model. The attitude data comes from many independent sources – mainstream pollsters such as YouGov, Ipsos, Pew and more, plus academic surveys and the UN and EU.
Figure 3: Public attitudes on climate change: the cultural causation model
The underlying theory is cultural causation: public attitudes are shaped mainly by cultures and their interactions. There is demonstrably a cultural entity, a secular religion, of climate catastrophism, which measurably dominates public attitudes (and policy too) across nations. It also interacts with the older culture of religion (any faith), which is why the predictor of national religiosity (NR) works.3 In other words, public attitudes to climate change (whether supportive or resistive) are largely motivated by the cultural narrative of global climate catastrophe, which has soaked national publics for decades now, and in the context of Figure 3 we can thus consider them to be ‘self-driving’, yet they are also highly influenced by NR.
Unfortunately cultural behaviours are rarely intuitive, and this characteristic is reflected by the manner in which national religiosity acts as a predictor. It is multi-modal, meaning that for a number of different generic types of survey question, NR predicts public responses in a correspondingly different way. To make these ways easier to understand I will focus on ‘climate-change most-endorsing’ responses only, i.e. those responses that most emphatically acknowledge man-made climate change, or most emphatically agree with policy actions to combat its effects. (Once we can predict such responses, in practice we also know, approximately, what the climate-change less-endorsing or climate change resistive responses must be, thus there is little extra insight from mapping these in detail).
So for example here are two ways via which national religiosity will work as a social predictor: across nations, the climate-change most-endorsing responses to unconstrained survey questions, strongly correlate with NR. Whereas the climate-change most-endorsing responses to reality-constrained survey questions, strongly anti-correlate with NR.
Unconstrained questions are open-ended and don’t introduce constraints in the minds of survey participants. An example is: “How serious do you think climate-change is?” Reality-constrained questions do introduce a constraint into participants’ minds, for instance a priority relative to other issues. An example is: “What do you consider the 3 most serious threats from this list of 10?” Climate-change is one of the threats on the list.
Here is a third way that national religiosity works as a social predictor: across nations, the climate-change most-endorsing responses to mixed-mode survey questions, as plotted against NR, occupy an envelope between two linear trendlines. A mixed-mode question is one that mixes both unconstrained and reality-constrained elements within the same question. The trendlines forming the envelope boundaries are those that would occur if each element alone was plotted against NR. This is a lesser prediction as there is no linear trend, but nevertheless a defined pattern.
If we think of the above examples as describing ‘rules’ that public responses obey in each scenario, then we need seven such rules in total to fully specify how natural religiosity (NR) can predict all international public attitudes to climate change, i.e. as generated by every generic type of survey-question. These rules are briefly summarised below; throughout, ‘responses’ refers to international (non-US) climate-change most-endorsing responses, as plotted against NR.
Rule 1. Responses to unconstrained questions, correlate with NR.
Rule 2. Responses to reality-constrained questions, anti-correlate with NR.
Rule 3. Responses to mixed-mode questions occupy an envelope between two linear trends. These linear trends are what would occur for each element if it was plotted alone.
Rule 4. Responses to extremely-weakly-framed questions, occupy an envelope between two very specific linear trends. These questions don’t have sufficient emotive content to evoke cultural responses; the boundary trendlines are the weakest unconstrained (Rule 1) and reality-constrained trends (Rule 2) that remain coherent.
Rule 4 is easier to understand as: even trivial questions on climate-change aren’t answered rationally, responses simply drift between the available cultural options.
Rule 5. The responses in Rule 1 and 2 may also be ‘lifted’ on the y-axis, while retaining their expected correlation / anti-correlation according to those rules. This is due to an element in the survey question that is not culturally disputed, so invokes the same level of response across all nations. The trendline boundaries of envelopes as described in Rule 3 and 4, may also be ‘lifted’ in this manner.
Rule 5 is easier to think about like this: if you want to demonstrate higher support, throw an uncontested truism into your question; it won’t remove the cultural gradient across nations, but it will push that whole gradient up onto a higher baseline.
Rule 6. The Rule 1 responses also exhibit different trendline gradients according to how emotively aligned to ‘Catastrophe Narrative’ each prompting survey question is. The more the emotive alignment, the steeper the trendline gradient. Catastrophe Narrative is the dominant public narrative about climate change, summarized as: ‘imminent global climate catastrophe’. Because cultures are polarising, these different gradient trendlines all pivot around a common point.
Rule 6 is easier to understand as: more emotive questions invoke more virtue-signalling support from adherents of climate catastrophism, yet also more resistance from those who instinctively reject this culture.
Rule 7. The Rule 2 responses also exhibit a proportional decline on the y-axis according to how strong the constraint in each prompting survey question is. The greater the constraint, the more the responses sink down the y-axis. A weak constraint is say choosing climate change (CC) as 1 of the 6 most important issues of 17. A stronger one would be choosing CC as 1 of the 3 most important from 12; stronger still would be choosing CC as the single most important issue of 10.
Rule 7 is easier to understand as: the more that reality constrains action against climate change in people’s minds, the less they’ll support it – and ‘full reality’ produces very little support at all!
The climate-change most-endorsing responses from any international (non-US) survey taken between 2015 to late 2022, should conform to the above rules.4
The Slide-Talk TGoC1 (an X post video, 20 slides, 35 minutes) provides example charts and full details for each rule. This represents a complete paradigm change, which urgently needs to be understood by academia and mainstream pollsters alike; at the moment their efforts effectively amount to blundering around in the dark.
The Slide-Talk shows how the rules work, but not why; for anyone seeking to understand this, my book The Grip of Culture provides a full explanation based upon the straightforward model of cultural causation.
While my book includes a list of technical reasons for why the Holy Grail predictor was missed, this can be summarised as being the result of entrenched bias in social science, which labours under a misapprehension that global climate catastrophe is an output of ‘hard science’, rather than recognising its true nature – an emotive cultural narrative that contradicts mainstream science. Of course, if you aren’t looking for a culture, you probably won’t find one!
The charts in the Slide-Talk make graphically much clearer what is less obvious from the above rules, which is that cultures can have very unintuitive effects. For instance many countries appear to be simultaneously extremely concerned about climate change, yet very keen that nothing should be done about it. Wanna know why? Read the book!
As well as paperback, this link leads to a FREE PDF.
Notes:
General: This post is an expanded version of the Net-Zero Watch article I authored here. (At the time this was released, I hadn’t yet created the Slide-Talk that presents all the rules in a such a clear format).
- One of the few things upon which I agree with the literature, is that the situation in the US is different, due to the very high degree of political polarisation there on climate change and many other issues. The theory of cultural causation still holds, but mapping this to the US is more complex. Chapter 11 in the book covers this (political stance is a great predictor, but more subtly 4 cultures are operating, of which one is still climate catastrophism).
- Lo and Chow’s result was due to a near miss of the correct theory, but unfortunately this was not followed up. Another study (T1) exceeds 30% for some nations but not others. My search of the literature has not been comprehensive, so I cannot be sure that other papers at least get close to the Lo and Chow result. However, confidence that my selection is reasonably representative is increased by the fact that Hornsey et al. (from which I have drawn the most predictors) is a meta study spanning 56 countries and 171 studies.
- All the predictor values from cultural causation in the bottom half of Figure 2 are taken from survey data between 2015 and very early 2020, i.e. pre-Covid. However, the cultural patterns still hold during and post Covid. A similar number of predicted attitudes from national religiosity have been measured in the period mid-2020 up to late 2022 (the latest measurements covered), which are likewise hugely better than the current literature, albeit the R2 values for the linear series are on average a little lower than for pre-Covid. This mild reduction is indeed very likely to be due to Covid, especially regarding reality-constrained attitudes, because Covid is a competing issue or threat.
- In addition to the caveat in note 3 above regarding data taken either before or during the Covid pandemic, see further caveats regarding the applicability of the predictor of national religiosity, such as selection bias, in the footnote on page 179 of ‘The Grip of Culture’. Also, because religion is very suppressed in certain countries, such as China and Vietnam, the predictor doesn’t work in these countries because a) there is no objective measure of religiosity anyhow, and b) as the suppression is very long term, we’d expect the cultural values associated with religiosity to be genuinely different than if the suppression had not occurred.