by Javier Vinós
Part 2 of a 3-part series. Part I is here.
The effect of the Sun on climate has been debated for 200 years. The basic problem is that when we study the past, we observe strong climatic changes associated with prolonged periods of low solar activity, but when we observe the present, we are able to detect only small effects due to the 11-year solar cycle. There are several possible explanations for this discrepancy. But the main question is how the Sun affects climate.
In this article we examine the effects on climate caused by the 11-year solar cycle over the last few cycles and their relation to recent climate change.
- The IPCC Says…
In its 5th Assessment Report, the IPCC used climate models to calculate the Sun’s contribution to warming. These models only take into account changes in the total energy coming from the Sun, which is known to vary by only 0.1%. Therefore, the IPCC’s answer is that the Sun has contributed nothing to the warming.[i] This is absurd given our knowledge of past climate and the fact that we passed through a 70-year solar maximum in the 2nd half of the 20th century, one of the most active periods of solar activity in thousands of years.

Figure after AR5, WGI, Ch. 5, FAQ 5.1, Fig. 1, pg. 393
The IPCC is ignoring a large body of evidence that the Sun affects climate in ways that cannot be explained by these energy changes alone. We have space to review only a few of these unexplained effects. Let’s start with the surface.
- Sun’s Effect on the Surface
Most of the Sun’s energy reaches the surface of the planet. If this energy increases by 0.1%, then every point on the surface receives 0.1% more. One would expect this to cause a small overall warming, estimated by scientists to be two hundredths of a degree Celsius, which is undetectable. But that is not what is being observed. Several studies show that over the solar cycle, the surface is warming 4 times more than expected, 0.1°C, and it is doing so in an extremely irregular way with large spatial variations.[ii]

Figure from Lean 2017. The surface temperature response to solar cycle from observations using multiple regression from the 1996 minimum to the 2002 maximum. On the right are zonally averaged changes.
Going from a solar minimum to a solar maximum, some areas show more than 1°C of warming, while others show more than half a degree of cooling. This is not the effect you would expect. If we analyze the average for each latitude, we observe a very strong warming around 60°N latitude. But if we analyze the change at 20 km altitude, in the stratosphere, we observe something very curious. The response in this layer of the atmosphere is inverse to the response at the surface. Why is this important? The IPCC tells us that one of the fingerprints of warming due to our emissions is that we see warming at the surface and cooling in the stratosphere. But if the Sun also shows an inverse response between the two, then the observation is no longer evidence of guilt from emissions. It could be the Sun. It is also important to note that the part of the globe that has warmed the most during global warming (since 1976) is the land surface of the Northern Hemisphere, precisely the region that shows the greatest warming in response to a more active Sun, while the tropics have barely warmed at all.
- Sun’s Effect on the Ocean
Years ago, some scientists studied the rates of warming and cooling in the upper layer of the tropical oceans. They found that it follows a cycle similar to that of the Sun.[iii] However, there is a problem: the variation in the Sun’s energy is ten times smaller than it would need to be to cause these changes. Instead of thinking that this supported an indirect effect of the Sun on climate, most scientists ignored the study.

Figure from White et al. 2003. Upper, heat storage anomaly above the 22°C isotherm from 30°S to 30°N expressed in W (stored)/m2. Lower, solar irradiation anomaly.
In the Pacific, trade winds push warm surface water westward, bringing up deep, cold water off the coast of South America. This is called the Neutral phase. In some years, the trade winds become stronger and push the cold water toward the center of the Pacific, accumulating more warm water to the west. This is the La Niña phase. In other years, the trade winds blow more slowly or in the opposite direction, the cold water stops rising in the east, and the water in the central and eastern Pacific warms. This is the El Niño phase. This oscillation affects the weather of much of the planet and we must remember that it has three states, not two.
Since 1990, there have been countless studies on the solar cycle and El Niño. You will not find any reference to them in review articles, books or IPCC reports.
I set out to investigate this relationship using solar activity data and the Oceanic El Niño Index, which shows in blue the periods when the equatorial Pacific is cooler than average and in red when it is warmer. Since solar cycles have slightly different lengths, I divided both data series into segments of a solar cycle and then adjusted the length to be the same for all cycles. This statistical technique is called epoch analysis. In this way, the mean and variance of the data are determined for periods that coincide in their phase of the cycle. This revealed a pattern that indicates an El Niño response to solar activity. I looked at a period when the cycle is gaining activity, which is accompanied by La Niña conditions. I used the Monte Carlo method to determine the probability that this result was random, and the answer was only 0.7%. This means that there is a 99.3% chance that the La Niña conditions at this time in the solar cycle are due to the Sun.

Figure shows Epoch analysis of solar activity and Oceanic El Niño Index. X-axis is the variable length of a full solar cycle. Right curves show the mean and standard deviation of left curves. Red rectangle indicates the part of the data analyzed by Monte Carlo method.
Since the answer is clearer for La Niña, I analyzed the relative frequencies of each phase of the El Niño phenomenon. What is observed is that the Neutral condition years follow the solar cycle in their frequency with a delay of one or two years. Surprisingly, the frequency of La Niña is the opposite of Neutral. The solar activity determines whether it is a La Niña year or a Neutral year. The Sun’s effect on El Niño years is less clear. El Niño seems to have another cause, which could be the amount of heat accumulated in the ocean. The solar pattern is confirmed by a study of El Niño frequencies since 1900, because among the repeating peaks there is an 11-year peak, which is the frequency of the solar cycle.[iv]

Figure shows the relative frequency for Neutral years (orange) and La Niña years (blue) from the official (Domeisen et al. 2019) classification shown in the bottom squares. Frequency was calculated for a 5-year sliding window and Gaussian smoothed.
It is striking that with so much evidence and studies, the vast majority of scientists do not know that the Sun controls the very important El Niño phenomenon. But El Niño is a product of the action of the trade winds over the equatorial Pacific. To control El Niño, the Sun must control the atmospheric circulation.
- Atmospheric Effects
We have known since 1988 that the Sun affects atmospheric circulation.[v] But like other effects of the Sun on climate, most scientists ignore this knowledge. This effect on the atmosphere may affect hurricanes in a much more significant way than global warming. The graph of the annual number of major hurricanes in the world (inverted) shows that the number of hurricanes tends to increase at or after the solar maximum.[vi]

Figure after Pielke & Maue 2024. Data for global major hurricanes (≥94 knots) from Ryan Maue, is an inverted and 3-year centered average. It displays a decadal periodicity.
How does the Sun manage to affect the atmosphere? In 1959, a scientist discovered that changes in the polar vortex seemed to respond to solar activity.[vii] This is a question that continues to be studied, and we are beginning to understand that much of the effect of solar activity on atmospheric circulation is due to this effect.
In the next graph, solar activity is represented in red. In purple at the bottom is the strength of the polar vortex.[viii] High values indicate a strong vortex and low values indicate a weak vortex. These values tend to show a large change from year to year. In blue you can see the cumulative wind speed that forms the polar vortex.[ix] When the curve goes up, it indicates that most of the time the speed is above average and the vortex is strong. When it goes down, it indicates the opposite.

This figure shows in red the monthly number of sunspots, in blue the cumulative anomaly of zonal wind speed at 54.4°N, 10 hPa (Lu et al. 2008), and in purple the mean vortex geopotential height anomaly at 20 hPa (NCEP, Christiansen 2010).
During Cycle 20 of low solar activity, the vortex wind was slower than normal and most years had a weak vortex. This corresponds to the late 1960s and early 1970s, when many winters were cold. Then came Cycle 21, which was very active. The wind speed increased, and there was only a weak vortex at the beginning and end of the cycle, when solar activity was low. In the late 1970s and 1980s the winters were warmer. Cycle 22 remained very active and the wind continued to be faster than normal, resulting in no weak vortex years. Winters continued to be warm throughout the 1990s. With Cycle 23, solar activity decreased again, leading to a decrease in wind speed. Weak vortex years returned. And also since the late 1990s, cold winters have returned, something that scientists who ignore the Sun’s effect on climate have trouble explaining.
The data I have does not cover solar cycles 24 and 25, but the correlation between low solar activity and cold winters continues, especially in eastern North America and Eurasia. Since the late 1990s, winters have tended to be colder across much of the Northern Hemisphere, while the Arctic has warmed, as the next figure shows.[x] The winter of 2024 was the coldest in Mongolia in decades. 6 million animals died, 10% of their population.[xi]

This figure shows the observed surface temperature trends for the months of January and February during the 1990–2015 period (Kretschmer et al. 2018).
Without understanding the effect of the Sun on the climate, this cannot be understood. None of this has anything to do with atmospheric CO₂. Acknowledging that the Sun controls the temperature of Northern Hemisphere winters implies that the sun has contributed to the observed warming, since much of the warming is due to increasing Northern Hemisphere minimum temperatures.
The Sun’s effects on the atmosphere also have a striking effect on the Earth’s rotation.
- Earth’s Rotation Effects
Since the middle of the 20th century, we have been able to measure the speed of the Earth’s rotation with great precision. In 1962, a French scientist realized that solar activity modified the rotation speed of the planet.[xii] Since then, this finding has been confirmed by dozens of studies. Climatologists are ignoring this finding.
I have also analyzed the data, and they leave no room for doubt. The Earth’s rotation increases twice a year, when winter arrives in each hemisphere. I chose to analyze the changes that occur between November and January because the change is smaller and more variable, allowing me to see the response better. This graph compares a high solar activity year with a low activity year. When activity is low, the rotation speeds up and each revolution is shortened by half a millisecond.

This figure shows the changes in the length of day in milliseconds for 2014 (red) and 2017 (black). IERS EOP C04 data with smoothing.
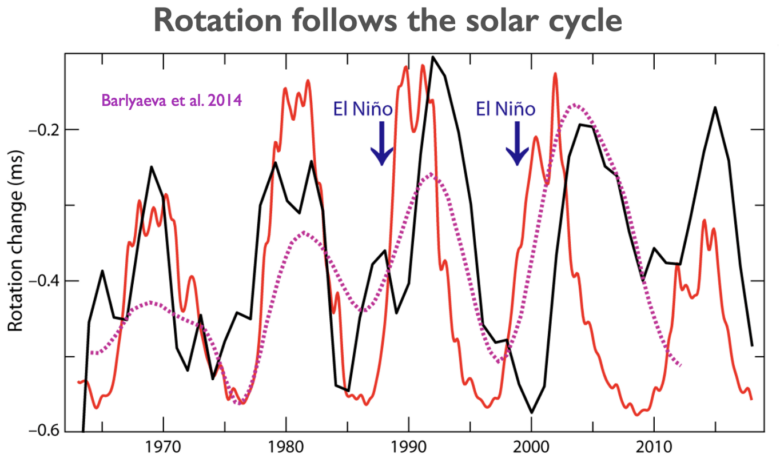
My analysis confirms what many researchers have found: the Earth’s rotation changes with solar activity. When solar activity is low, the rotation accelerates more between November and January, and when it is high, it hardly accelerates at all. The effect is disturbed by other phenomena that also affect the rotation of the planet, such as El Niño, but the 11-year cycle is clear. The result obtained in other studies with a different treatment of the data is similar. [xiii]

This figure shows in red solar activity (10.7 cm flux), in black the 3-point smoothed amplitude of the NH winter change in length-of-day, and in purple the result from Barlyaeva et al. 2014.
The effect of the Sun on the rotation has been known for 60 years, and yet no explanation has been given. Its cause must necessarily lie in changes in the angular momentum of the atmosphere. The exchange of angular momentum between the Earth and the atmosphere can be understood in terms of what happens to an ice skater when he turns. As the arms move away from the body, the spin becomes slower, and as they move closer, the spin becomes faster. The problem is that changes in angular momentum large enough to affect the Earth’s rotation cannot be caused by changes as small as 0.1% in the energy deposited on the surface by the Sun.
- Conclusions
None of what you have just read is reflected in the IPCC reports, which ignores the large amount of evidence showing that the Sun’s effect on climate is not limited to a small change in energy. And none of this is in the climate models.
To recapitulate, we have seen that the changes caused by the Sun on the surface have inverse dynamic patterns to those of the stratosphere, which is the same fingerprint at CO2-driven warming. We have seen that the Sun causes temperature changes in the ocean far greater than expected, and that it influences ENSO, a major global climate phenomenon. We have seen that the Sun regulates the strength of the polar vortex, which affects the frequency of very cold winters in much of the Northern Hemisphere, and we have seen that it alters the rotation of the planet. None of this can be explained by a 0.1% change in the energy reaching the planet’s surface from solar minimum to solar maximum. There is something else. Something that has been studied since 1987 that can explain these effects. The IPCC knows about it and mentions it in its 5th report, but is unwilling or unable to understand its global significance.
It can be argued that the effects of solar activity on climate that we have analyzed are periodic. Solar activity varies cyclically every 11 years, El Niño gives way to La Niña, the vortex changes its strength every winter, and the rotation of the planet returns to what it was. However, there are two things indicating that there is a much stronger long-term effect, and therefore that solar activity has a cumulative effect on climate that we do not yet understand well. One is that, as we have seen, the winter temperature trends in the Northern Hemisphere change over decades with solar activity, causing a warming in the Arctic and a cooling in North America and Eurasia during the winter since the late 1990s, which has been going on for 25 years now because of the low solar activity that we have had in the 21st century. The other is that, as we saw in the first part, low activity for more than a century in the past was the cause of some of the major climate changes of the Holocene.
I have spent the last 10 years trying to understand how climate changes naturally, without preconceived ideas, by examining a huge amount of information and data. The evidence has led me to an alternative theory of climate change to that of the IPCC. It is not based on changes in solar activity, but, to my surprise, it explains them. There is much more to climate than the Sun, but the conclusion is that the 20th century solar maximum has been a major contributor to recent warming. And it is not lost on me that this means that controlling our emissions, which has become the main goal of the UN and the Western world, may not have much effect on future climate.
This article can also be watched in a 16-minute video with English and French subtitles.
References
[i] Masson-Delmotte, V., M. et al., 2013. Information from Paleoclimate Archives. In: Climate Change 2013: The Physical Science Basis. Fifth Assessment Report of the IPCC. FAQ 5.1, Fig. 1 pg. 393.
[ii] Lean, J.L., 2017. Sun-climate connections. In Oxford Research Encyclopedia of Climate Science.
[iii] White, W.B., Dettinger, M.D. & Cayan, D.R., 2003. Sources of global warming of the upper ocean on decadal period scales. Journal of Geophysical Research: Oceans, 108(C8).
[iv] Deser, C., et al., 2010. Sea surface temperature variability: Patterns and mechanisms. Annual review of marine science, 2, pp.115-143.
[v] Labitzke, K. & Van Loon, H., 1988. Associations between the 11-year solar cycle, the QBO and the atmosphere. Part I: the troposphere and stratosphere in the northern hemisphere in winter. Journal of Atmospheric and Terrestrial Physics, 50(3), pp.197-206.
[vi] Pielke Jr., R., & Maue, R. 2024. Global Tropical Cyclones.
[vii] Palmer, C.E., 1959. The stratospheric polar vortex in winter. Journal of Geophysical Research, 64(7), pp.749-764.
[viii] Christiansen, B., 2010. Stratospheric bimodality: Can the equatorial QBO explain the regime behavior of the NH winter vortex? Journal of climate, 23(14), pp.3953-3966.
[ix] Lu, H., et al., 2008. Decadal‐scale changes in the effect of the QBO on the northern stratospheric polar vortex. Journal of Geophysical Research: Atmospheres, 113(D10).
[x] Kretschmer, M., et al., 2018. More-persistent weak stratospheric polar vortex states linked to cold extremes. Bulletin of the American Meteorological Society, 99(1), pp.49-60.
[xi] The New York Times, 2024. A Harsh Mongolian Winter Leaves Millions of Livestock Dead.
[xii] Danjon, A, 1962. La rotation de la Terre et le Soleil calme. Comptes Rendus Hebdomadaires des Seances de l’Academie des Sciences, 254(17), p.3058.
[xiii] Barlyaeva, T., Bard, E. & Abarca-del-Rio, R., 2014. Rotation of the Earth, solar activity and cosmic ray intensity. Annales Geophysicae Vol. 32, No. 7, pp. 761-771.
![Tropical Tidbits - [Sat / Aug 21] Hurricane Henri Nears makes landfall in New England](https://news7g.com/wp-content/uploads/2021/11/113828_5day_cone_no_line_and_wind-390x220.png)