Guest post by Antonis Christofides, Demetris Koutsoyiannis, Christian Onof and Zbigniew W. Kundzewicz
On the chicken-and-egg problem of CO2 and temperature.
Bare facts vs. mechanism
A car is travelling at 80 km/h, and a ray of light is travelling parallel to the car, in the same direction. Its speed relative to the Earth is 300,000 km/s. What is its speed relative to the car? Today we know that the answer “300,000 km/s minus 80 km/h” is wrong. But in 1887, people thought that it was self-evident and undisputable—after all, it’s basic logic and simple arithmetic. At that time, physicists Michelson and Morley had devised a method with sufficient accuracy to measure the small differences in the speed of light, and in an effort to discover details about its movement, they conducted one of the most famous experiments in the history of science. The results were baffling. The speed of light was constant in all directions—the direction of the Earth’s movement, the opposite direction, and the perpendicular direction. There was no explanation for that—it defied all logic.
However, we have to look at the bare facts, regardless how impossible they seem. Michelson and Morley did not feel compelled to provide an alternative theory of light, or of anything. They concluded that their results “refute Fresnel’s explanation of aberration” and that Lorentz’s theory “also fails.” Had they written “we have no idea what’s going on” it would have been the same. Making their negative results public opened the road to further research. It was a long road, and it took almost twenty years of work by distinguished scientists before arriving at the theory of relativity.
It goes without saying that this is hardly the first or the last mystery in the history of science. One that is still unsolved is the changing mass of the International Prototype of the Kilogram. Until a few years ago, the kilogram was defined as the mass of a platinum-iridium object stored in the International Bureau of Weights and Measures in Paris. It has been found that its mass changes over time by something like 0.000005% per century, and no-one knows why exactly. That no-one knows the mechanism does not alter the fact that the mass does change.
How a clear case of causality can become a noisy mess
Imagine a beach being hit by small waves. Once in a while, a series of noticeably larger waves arrive. There’s a port 10 km further, and ships are departing from it. We might notice that the departures of the ships are correlated to the instances of larger waves, and suspect that there could be a causal relationship.
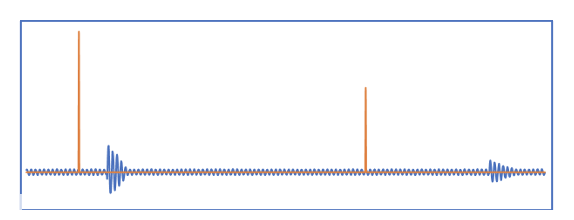
In reality, in this case we understand the mechanism through which the ships cause the waves; but if we assume we don’t, here is how we might try to investigate: we might draw a chart like the following, where the horizontal axis is time, the orange line shows ship departures (the vertical axis showing the size of the ship) and the blue line shows sea level. If every departure was reliably followed by a temporary increase in wave height, we could conclude that the departures of the ships potentially cause the increase in wave height, especially if we noticed that the size of the ship is correlated to the size of the increase in wave height.

We say “potentially” because we can never be certain about causation. It could be that the departures and the waves both have a common cause. Even if someone was shot in the head, we can’t be certain it was the bullet that killed him—he might have suffered a stroke just before the bullet entered his brain (Agatha Christie’s Poirot has resolved several mysteries of similar type). So we can hardly be 100% certain that X causes Y. One thing is clear, however: the waves do not cause the ships to depart. The reason is that first the ship departs and later the waves hit the beach. The effect cannot precede the cause.
Even in this simple case where there’s an impulse (the departing ship) followed by a response, things can quickly get complicated. Ships could be going in many different directions, and the response would not always appear in an equal time interval after the impulse. For some impulses the response could be totally absent (e.g. for ships that depart in a direction away from the beach). The interval between departures could be smaller than the time it takes for the response to arrive, and the intertwining of impulses and responses could be confusing. Sometimes responses might appear out of the blue, without impulse (for example, there could be arriving ships that cause that, which we might not have taken into account). It might not be as easy to distinguish the wave response from the other waves if the sea is rough. Add all these factors together, and the blue line could be a big noisy mess.
And in a real world example, like in the question of whether CO₂ concentration affects the temperature, both lines can be a big noisy mess.
Investigating potential causes
So here is the question: given two processes, how can we determine if one is a potential cause of the other? We deal with this question in two papers we published last year in the Proceedings of the Royal Society A (PRSA): Revisiting causality using stochastics: 1. Theory (preprint); 2. Applications (preprint). We reviewed existing theories of causation, notably probabilistic theories, and found that all of them have considerable limitations.
For example, Granger’s theory and statistical test have already been known to be identifying correlation (for making predictions), not causation, despite the popular term “Granger causality”. What is more, they ignore the fact that processes exhibit dependence in time. Hence, formally testing hypotheses in geophysics by such tests can be inaccurate by orders of magnitude due to that dependence.
As another example, Pearl’s theories make use of causal graphs, in which the possible direction of causation is assumed to be known a priori. This implies that we already have a way of identifying causes. Moreover, insofar as those theories assume, in their use of the chain rule for conditional probabilities, that the causality links in the causal graphs are of Markovian type, their application to complex systems is problematic.
Another misconception in some of earlier studies is the aspiration that by using a statistical concept other than the correlation coefficient (e.g. a measure of information) we can detect genuine causality.
Having identified the weaknesses in existing theories and methodologies, we proceeded to develop a new method to study the question whether process X is a potential cause of process Y, or the other way round. This has several key characteristics which distinguish it from existing methods.
- Our framework is for open systems (in particular, geophysical systems), in which:
- External influences cannot be controlled or excluded.
- Only a single realization is possible—repeatability of a geophysical process is infeasible.
- Our framework is not formulated on the basis of events, but of stochastic processes. In these:
- Time runs continuously. It is not a sequence of discrete time instances.
- There is dependence in time.
- It is understood that only necessary conditions of causality can be investigated using stochastics (or other computational tools and theories)—not sufficient ones. The usefulness of this, less ambitious, objective of seeking necessary conditions lies in their ability:
- To falsify an assumed causality.
- To add statistical evidence, in an inductive context, for potential causality and its direction.
The only “hard” requirement kept from previous studies is the temporal precedence of the cause over the effect. Sometimes it can happen that causation goes both ways; for example, hens lay eggs and eggs hatch into hens (and it was Plutarch who first used the metaphor of hen and egg for this problem). Conveniently, we call such systems “potentially hen-or-egg causal”. Our method also identifies these, and also determines in these cases which of the two directions is dominant.
To deal with dependence in time, often manifested in high autocorrelation of the processes, we proposed the differencing of the time series, which substantially decreases the autocorrelation. In other words, instead of investigating the processes X and Y and find spurious results (as has been the case in several earlier studies), we study the changes thereof in time, ΔX and ΔY.
A final prominent characteristic of our method is its simplicity. It uses the data per se, rather than involved transformations thereof such as the cross- and auto-correlation functions or their Fourier transforms —the power spectra and cross-spectra. The results are thus more reliable and easier to interpret.
Atmospheric temperature and CO₂ concentration
In our PRSA papers we implemented our method in several case studies, such as rainfall-runoff and El Niño-temperature. One of the case studies was CO₂ concentration and temperature, and this one gave strong indications that temperature is potentially the cause and CO₂ the effect, while the opposite causality direction can be excluded as violating the necessary condition of time precedence.
However, the scope of these two papers was to formulate a general methodology for the detection of causality rather than to study a specific system in detail, and the case studies were brief. With regard to the relationship between temperature and CO₂ concentration, we hadn’t gone into details as to the effect of seasonality and time scale, or the exploration of many sources of data. So in our latest paper, published a week ago in Sci (“On hens, eggs, temperatures and CO2: Causal links in Earth’s atmosphere”), we studied the issue in detail. We used CO₂ data from Mauna Loa and from the South Pole, and temperature data from various sources (our published results are for the NCAR/NCEP reanalysis, but in the previous papers we used satellite data too). We used both historical data and the outputs of climatic models. We examined time scales ranging from months to decades.
The results are clear: changes in CO₂ concentration cannot be a cause of temperature changes. On the contrary, temperature change is a potential cause of CO₂ change on all time scales. As we conclude in the paper, “All evidence resulting from the analyses of the longest available modern time series of atmospheric concentration of [CO₂] at Mauna Loa, Hawaii, along with that of globally averaged T, suggests a unidirectional, potentially causal link with T as the cause and [CO₂] as the effect. This direction of causality holds for the entire period covered by the observations (more than 60 years).”
The math is a bit too complicated to present here. However all three papers have been reviewed extensively by referees and editors (notice in the last paper that four editors were involved as seen on the front page of the paper). The results in the earlier papers were criticized, formally by a commentary in the same journal and informally in blogs and social media. Some concerns expressed by critics, such as about lengths of time series, effect of seasonality, effect of timescale, are dealt with in this new paper. No-one has however developed any critique of the methodology.
In addition, the following graphic (taken from the graphical abstract of the paper and inserted here as a quiz) aims to make things even clearer. In this we plot the time series on the annual scale to avoid too many points. Hopefully even the annual scale of this graph (in contrast to the monthly scale we used in our detailed results) suffices to suggest that there is very little doubt as to the potential causality direction.

Do climate models faithfully represent the causality direction found in the real world data? This question is also investigated in our new paper. The reply is clearly negative: the models suggest a causality direction opposite to the one found when the real measurements are used. Thus, our methodology defines a type of data analysis that, regardless of the claims we infer about the detection of causality per se, assesses modelling performance by comparing observational data with model results. In this, it contributes in studying an epistemological problem and, in particular, it casts doubt over the widespread claims that “in silico experimentation” with climate models is the only option we have and that this can be justified by the (insufficiently validated) assumption of an “increasing realism of climate system models”.
One might think that the potential causality direction we determined is counterintuitive in the light of the well-known greenhouse effect, and that the effect of temperature on CO₂ concentration would be subtle. But no, it is quite pronounced. In fact, human emissions are only 4% of the total, natural emissions dominate, and the increase of the latter because of temperature rise is more than three times the human emissions. This it is visible in a graph we included in an Appendix to the paper.

Figure A1 from Koutsoyiannis et al. (2023): Annual carbon balance in the Earth’s atmosphere in Gt C/year, based on the IPCC estimates. The balance of 5.1 Gt C/year is the annual accumulation of carbon (in the form of CO2) in the atmosphere.
Of course, several questions remain. Why does the temperature increase? And why does the temperature rise potentially cause an increase in CO₂ concentration? Is the temperature change a real cause of the CO₂ concentration change, or could they both be the result of some further causal factor? It’s not hard to speculate. Yet we briefly investigate quantitatively possible mechanisms for these causal relationship in the appendices to the paper. However, if we stick to the facts, two things are clear: (i) changes in CO₂ concentration have not been warming the planet; (ii) climate models do not reflect what the observational data tell us on this issue.
JC comment: I find this analysis to be very interesting. The global carbon cycle is definitely “unsettled science.” I think what this paper shows is that CO2 is an internal feedback in the climate system, not a forcing (I think that Granger causality would reveal this?). Yes, this all depends on how we define the system, and humans and their emissions are currently acting outside of the system in most climate models and are considered as an external forcing. Again, as emphasized in the paper, human emissions are small fraction of natural emissions so this issue of internal versus external isn’t straightforward. By analogy, in the 1970’s climate models specified cloud cover, and hence clouds acted as an external forcing. However, clouds vary in response to the climate, and now with interactive clouds, clouds are now correctly regarded as a feedback and not a forcing.
References
- Koutsoyiannis, C. Onof, A. Christofides, and Z. W. Kundzewicz, Revisiting causality using stochastics: 1.Theory, Proceedings of The Royal Society A, 478 (2261), 20210835, doi:10.1098/rspa.2021.0835, 2022.
- Koutsoyiannis, C. Onof, A. Christofides, and Z. W. Kundzewicz, Revisiting causality using stochastics: 2. Applications, Proceedings of The Royal Society A, 478 (2261), 20210836, doi:10.1098/rspa.2021.0836, 2022.
D. Koutsoyiannis, C. Onof, Z. W. Kundzewicz, and A. Christofides, On hens, eggs, temperatures and CO₂: Causal links in Earth’s atmosphere, Sci,