On Tuesday about a half-dozen folks sent me messages regarding an intense radar band over western Puget Sound and the San Juans. Others reported continuous lightning and hours of downpours.
This is after a relatively warm, dry summer. So I decided to take a look at this unusual feature.
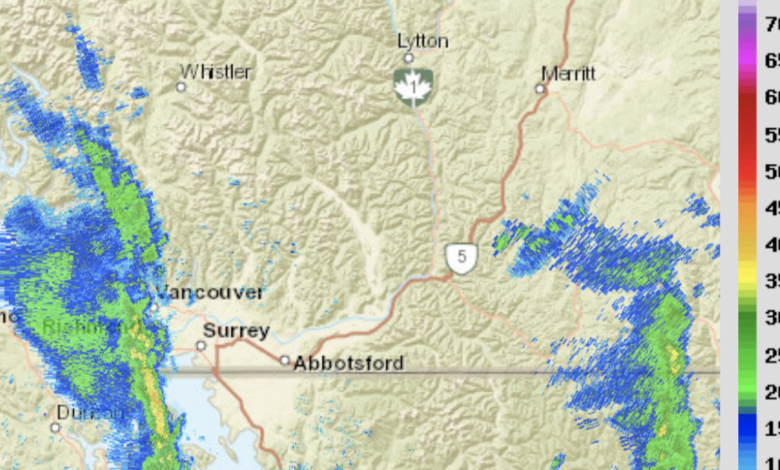
The radar signature was impressive, with a long intense line stretching from around Tacoma to the San Juans for hours (see radar image just after noon on Tuesday). And this band held in for hours.

The precipitation band was highly convective, with lots of thunderstorm activity. Thus, the lighting map for all of Tuesday showed an impressive line of lightning activity that passed over those poor folks in the San Juans. Lots of lightning over eastern Washington as well, but over a broad area.

How much rainfall fell that day?
The Tuesday totals were impressive, reaching 1.43 inches over eastern Orcas Island and 1.10 over Friday Harbor. As a result, Friday Harbor ended up with one of its wettest Augusts over the past few decades.

Now the depressing part for me. High-resolution models failed to simulate this convective line. Not the UW WRF modeling system nor the NOAA National Weather Service HRRR model.
So now the detective work begins. Failure is always more educational than success.
The thunderstorms in the line were relatively small, compared to the big ones in Eastern Washington (see satellite image around the same time as the radar picture)

The thunderstorms were aligned with the airflow aloft….which was from the south-southeast from around 13,000 ft to 20,000 ft (see map of winds and pressures/heights at 500hPa…around 18,000 ft). The red arrow shows the direction of the flow aloft. A low/trough was approaching, which was important. Such a trough provides lift or upward motion and it is associated with cold air aloft (green colors).

Cold air moving in aloft promotes instability….the mixing of the atmosphere in the vertical… because it enhances the decrease of temperature with heights. Large declines in temperature with height causes the atmosphere to become unstable, which leads to cumulus clouds and thunderstorms.
No wonder there were a lot of thunderstorms over the region…the air was unstable and that instability is promoted by the upward motion associated with an approaching upper level trough.
But why is the narrow line of thunderstorms oriented roughly north-south? Could this represent a convergence zone downstream of Mount Rainier? Both the Olympic Mountains and Vancouver Island have convergence zones in their lee that produce convective shower lines when the winds are from the northwest ( see example below)

But this hypothesis will not work in this case because the low-level winds (below 12000 ft, where most of the blocking effects of Rainer are produced), were not from the south-southeast.
Then I took a look at the high-resolution WRF simulation from Tuesday to see what it was trying to do. Although the model did not have the line during the afternoon, it had something similar around 5 AM in the morning (see below).

Anyway, I will examine the origin of this line more comprehensively over the next few days and let you know what I find.