Arvid Pasto
August 2024
A key climate parameter called “climate sensitivity” has been the subject of scientific research for hundreds of years. Essentially, it is global warming due to doubling of atmospheric CO22. If the value of the parameter is 2, then the world temperature will increase by 2°C when CO2 atmospheric levels are twice as high as they are today. By implication, therefore, it is a constant number. Scientific estimates have ranged widely, from less than 1 to more than 6 (see below). Precise knowledge of its value is as “invaluable” to climate modelers and alarmists as the Golden Fleece was to its owner in Greek mythology.
While global warming is believed to arise from the presence of greenhouse gases in our atmosphere, much attention has been devoted to assessing the impact of these gases (mainly CO2methane and nitrous oxide, along with a myriad of gases that are usually present at very low concentrations).
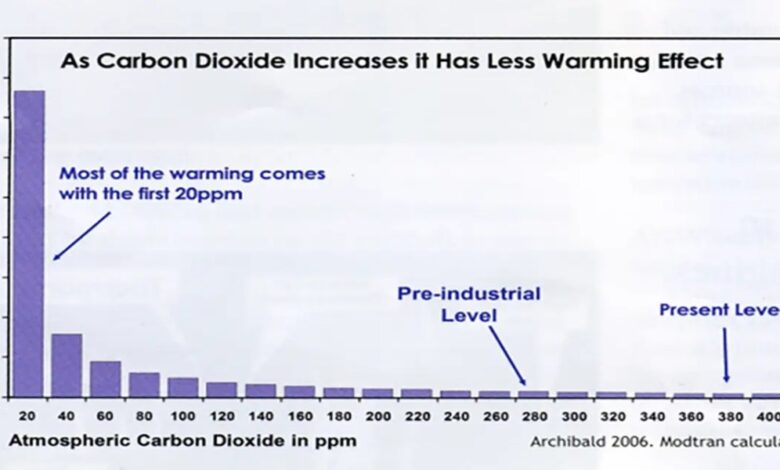
Blame any single factor for global temperature change, such as CO2is madness. Beer’s Law1 describes the famous phenomenon of “saturation”, in which CO2 increase, atmospheric temperature will increase rapidly starting from CO2 level of zero, but as it increases, the temperature increase is NOT linear. Instead, it decreases, eventually appearing to stabilize. (Figure 1) So you can see that, using just one factor, climate sensitivity is NOT constant. However, at high CO2climate sensitivity can be considered to be “nearly” constant. There is a perfectly good reason for that behavior, as can easily be demonstrated1. The main result of this expression is that after a certain amount of CO2 already added to the atmosphere, any additional amount will cause a smaller increase in temperature. At some level, these increases will be negligible.

Figure 1. Effects of CO2 Focus on global warming
(From page 8 of The Skeptic’s HandbookJoanne Nova 2009)
The same nonlinear relationship holds true for any gas in the atmosphere. And of course, our atmosphere is made up of anything but a single gas. Each will exhibit its own self-flattening concentration-temperature curve, depending on its properties.
Theoretically, given the precise composition of the atmosphere and the spectral properties required for each gas, the calculation of the resulting absorption curve should be straightforward. The global temperature of the Earth is assumed to be regulated by the balance between incoming solar radiation plus the heat produced by the Earth itself and the heat radiated away (radiated).
Gas molecules will absorb heat from both incoming and outgoing radiation. Incoming heat is absorbed primarily through electronic transitions, while outgoing heat is absorbed through vibrations and/or rotations of the molecules. These interactions can be easily measured spectroscopy, with each species exhibiting a distinct absorption spectrum versus radiation wavelength (or frequency). See Figure 2.

Figure 2. Energy absorption by some gases according to the wavelength of incident radiation and their effects on the incident solar radiation and the radiation emitted by the earth. (Excerpt from a presentation by Dr. William Happer, Princeton University, at Marshall University)
One can then calculate how much heat will be generated in the atmosphere through these processes, since the specific heats of each component are known. This calculation essentially asks: how much heat is generated, and then how much of a change in temperature does that heat cause?
Such calculations have been performed for many years, with results such as those shown below. These calculations allow for more accurate estimates of the “greenhouse effect” of a given gas, since one can simply double the concentration of the species of interest in the calculation and see what happens. (Figure 3)

Figure 3. This figure shows the increase in CO2 Levels from 0 ppm (green line) to 400 ppm (about today’s value, black line) have a significant impact, increasing the earth’s temperature compared to the level without CO22 (about 16°F) to current levels (about 60°F). You can clearly see that the doubling of CO2 to 800 has almost no effect (red line). [Ron Clutz.com 2021]
The two main “evil” of climate change, CO2 (carbon dioxide) and CH4 (methane) are easily shown to be unlikely to cause any significant global warming, through calculations such as those discussed above. Both are known to be steadily increasing (Figures 3 and 4) and have been considered the main cause of global warming for decades.

Figure 3. CO2 Earth’s atmospheric concentration by 20232.
Clearly, there is something missing from these global warming calculations. Many factors, in addition to atmospheric heating, are easily deduced. These include assumptions about how much of the incoming solar radiation is reflected or absorbed by clouds or the oceans, how much of the incoming light is scattered by clouds or “dust” in the atmosphere, how much of the incoming light is reflected by clouds, or by patches of ice and snow on the Earth, and many more. The latest climate models have defined all of these terms in great detail (Figure 5).
Other less-explained factors include external heat sources (underwater volcanoes, underground coal or methane fires), soot deposited on glaciers (which absorbs heat), recent large global wildfires (which produce heat, soot, and CO2), and others.
Finally, there are so-called “feedbacks”: these involve interactions between two gases such as CO2 and water vapor, and others. These can be positive, in which the presence of a gas, such as CO2are thought to cause an increase in the presence of another factor, such as water vapor, from increased evaporation from the oceans. They can also be neutral or negative. (Figure 6) Heat inputs, called “forcing factors,” are added to “feedbacks” in climate models.

Figure 6. Climate feedbacks considered in global climate models. [From IPCC AR4 report.]
The water vapor feedback is particularly troubling: it is NOT known to be “positive,” much less positive than climate scientists claim.
Because there are so many forcing factors and so many complex feedbacks, climate sensitivity cannot be calculated. before. Always have to make assumptions. Yet scientists have tried in vain for decades to do so. (Figures 7, 8, 9)

Figure 7. Scientific estimates of climate sensitivity. In 2013, Nobel Prize-winning physicist Nur Shaviv said of this graph, “On a more serious note, let me put this into perspective with the most boring graph I have ever drawn in my life. Here is the range of possible climate sensitivity over time. As you can see, with the exception of the slightly smaller range of AR4 mentioned above, the range of possible climate sensitivity has not changed since Charney report in 1979. In other words, after investing perhaps billions of dollars in climate research over more than three decades, our ability to answer the most important question about climate has not improved at all!“

Figure 9. Historical estimates of climate sensitivity.
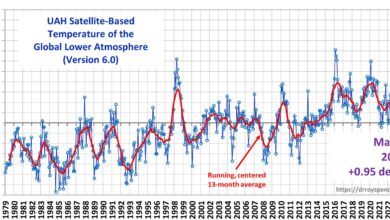
It turns out that climate sensitivity is actually a physically useless term, except to help indicate the impact of certain forcings or feedbacks on global warming. Global atmospheric temperatures can now be measured directly 24 hours a day by satellites and/or weather balloons, and ocean temperatures by buoys, and “earth” temperatures by thermometers placed on every continent. (The latter two have their own problems, especially with surface measurements, but those will not be discussed here.)
Global climate models currently used on supercomputers around the world do not actually use “climate sensitivity” as an input, but their output can be used by general scientists to suggest its value from computer inputs and outputs.
Looking at the actual global temperature results compared to the results of computer climate models (black line in Figure 10), one can see that the Earth’s temperature is NOT increasing at the rate predicted by the “climate sensitivity” above 2.
Global CO2 1976 level is2 332 ppm, and the initial temperature change is taken as 0.00. In 2016, CO2 is 404, and the temperature has increased by 0.3°. At an average rate of increase of 2 ppm/year, it would take 166 years to double since 1976. {I use 2 ppm/year, although from 1976 to 2016 it was 1.8 ppm/year, but recently it has increased to over 2 ppm/year}. Now, 40 years represents 0.24 of that time difference (40/166). So the “climate sensitivity” starting in 1976 would be 0.3°C/0.24, or 1.25. If the climate sensitivity (CS) is 2, then the temperature is expected to increase by 0.48°, and if the CS is 3, then the temperature increase will be 0.72°C, etc. The average values of the climate models shown on the graph give a climate sensitivity of 4 to 5 (and increasing).

Figure 10. Comparison of computer climate model predictions and actual observed global temperatures. [From Dr. John Christy, Univ. Alabama-Huntsville]
If the rate of increase of CO2 increase significantly over the next few decades, so will climate sensitivity, and so will projected global temperatures. In fact, CO2 Emissions are expected to slow, which will prolong CO2 doubling time and reduced climate sensitivity.
However, because of the actual temperature and CO2 The data shows that the current climate sensitivity is around 1.25, clearly something is wrong with the current “fashion” of climate sensitivity being 3 or higher.
AND…the real problem with the term “climate sensitive” is that it implies that CO2 is the cause of climate change, but it is not.
REFERENCES
- MN Berberan-Santos, “Beer’s Law Revisited”, Journal of Chemistry, No. 67, September 1990
- https://www.statista.com/statistics/1091926/atmospheric-concentration-of-co2-histocal/q
Related