Frans Schrijver
Klimaatfeiten.nl (in Dutch)
Apr 15, 2022
The general view in society is that human emissions of CO₂ are the all-determining cause of the increased concentration in the atmosphere. Most scientists and even many climate skeptics do not question this. There is some debate about how long this extra CO₂ will stay in the atmosphere, but that’s about it. That’s remarkable, as several scientists have published extensively on the flaws and inconsistencies of this narrative. By looking at the significant increase in the CO₂-flows from and to land and sea it’s in fact easy to see that the CO₂-rise is largely due to natural causes.
The idea that human CO₂ is the all-determining cause of the increased concentration is based on the assumption that the natural inflows and outflows are always and exactly in equilibrium with each other. Based on this perfect equilibrium thinking, human emissions, even though they are relatively small, cause a perturbation year after year. In the so-called global carbon budget[2] about 10 PgC of CO₂ is added every year, while the absorption flux has only increased by 6 PgC/yr (1 Petagram = 1 Gigaton = 1 billion tons). The concentration therefore continues to rise indefinitely as long as people emit CO₂.
To support this idea it is also assumed that human emissions accumulate in the atmosphere. Where you would expect a single residence time for a reservoir with in- and outflows, the IPCC-models calculate with a small residence time of about 4 years for natural CO₂ and a large one for human CO₂: “The removal of all the human-emitted CO2 from the atmosphere by natural processes will take a few hundred thousand years (high confidence)”.
Several scientists, including Murray Salby[9] and Hermann Harde[3], have published extensively on the flaws and inconsistencies of this narrative. They also showed that it is very illogical to think that a slight increase in the up-flux cannot be compensated by a larger down-flux. It’s like increasing the heat energy flow in a house by 5% and expecting that the temperature will keep on rising forever.
Despite this, belief in the IPCC’s model for the increase in concentration is persistent. In this article we will focus on one of the strangest assumptions: the idea that the in- and outflows are stable and in perfect equilibrium. Although they are about 20 times larger than anthropogenic fluxes and have different drivers for up and down, natural flows are not included in the material balance used in the models.
It is in fact easy to see that the increase in the CO₂ concentration is for the most part the result of natural changes, based on the following unmistakable observations.
- Fluxes to and from land and sea have increased significantly since 1750.
- The increase in these fluxes is natural, i.e. not due to human emissions.
- The growth of the natural fluxes can only take place at a higher concentration in the atmosphere.
- Natural fluxes have increased since 1750

The IPCC’s AR5 report[6] clearly shows that natural fluxes to and from land and sea have increased. We can see this in the well-known figure 6.1 from the AR5 report. In this figure (Figure 1) you can see that the total human emissions are almost 10 PgC/yr. The natural fluxes are much larger. To and from the sea this is about 80 PgC/yr, to and from land about 120 PgC/yr.
The fact that these natural flows have grown considerably since 1750 is visible in the figure from the color of the arrows. The black arrows indicate the original equilibrium situation as it once was in 1750. The red arrows indicate the new flows or the changes since that time. Emissions from the oceans have increased by 17.7 PgC/yr, emissions from land by 11.6 PgC/yr, so all together this amounts to almost 30 PgC/yr. The natural down fluxes have increased even slightly more.
If we show the important flows horizontally and in the correct proportion, the simplified picture looks like this (Figure 2).
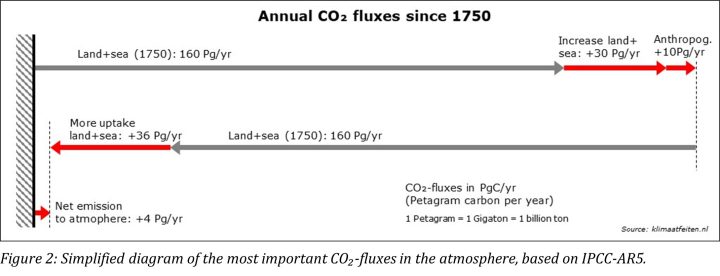
It is now clear at a glance that natural emissions have increased by a factor of 3 more than human emissions. We also see that the natural absorption has increased, but less than is needed for balance. This leaves a net increase of about 4 PgC/yr towards the atmosphere.
- The increase in CO₂ flows is natural
The second question that has to be answered is what is the cause of this increase; is it a natural flux change or is it the result of human influence?
Oceans
Henry’s Law plays a central role in the inflows and outflows from the sea. This law says that the amount of dissolved gas in a liquid is directly proportional to the concentration of the gas. With a high CO₂ concentration in the air, water absorbs more CO₂; at a low concentration the absorption is lower. In addition, the ratio depends on the temperature. At a low temperature, water can contain a relatively large amount of CO₂; at a high temperature less (warm beer contains less carbonation than cold beer).
This means that temperature has a direct influence on the ocean’s emissions. A high temperature means more emission and less absorption, a low temperature exactly the opposite. We know that the global temperature has increased since 1750 by about 1 °C. The question is: how great is this influence?
Hermann Harde[5] has performed a calculation based on physical data. Using Henry’s Law, he calculated the change in partial CO₂ pressure with a temperature increase of 1 °C. From measurements it is known how much the outflow increases or decreases depending on the change in the partial pressure. At 1 °C temperature increase, this results in an increase in emissions from the oceans of 19 PgC/yr. This is in good agreement with the increase of 17.7 PgC/yr from the IPCC report of 2013.
It’s important to mention that this temperature sensitivity deviates from calculations that are based on ice core measurements in Antarctica. These data show a ratio of the order of 100 ppm at a temperature increase of 10 °C, so much smaller. However, it is highly questionable whether this ratio is correct. As early as 1978, Stauffer and Berner[12] concluded: “We estimate the fraction of CO₂, present in bubbles to be only about 20%. The remaining part is dissolved in the ice.” Other scientists such as Jaworowski[7] and Harde[4] have also discussed major imperfections of ice core measurements in various publications. Contrary to what is often assumed, the ice layers are not a closed system. The air in the air bubbles in the deep ice layers no longer has the same composition as when the air bubbles were formed.
The calculation of Harde is far more reliable as it is based on reproducible physical data and confirmed by the observed larger emission from the oceans. This greater emission leads to a higher concentration in the atmosphere and thus, under the influence of Henry’s Law, also to a greater absorption by the oceans.
Land

With respect to land emissions we have to distinguish between plant respiration and soil respiration. About half of the CO₂ that plants absorb through photosynthesis disappears almost immediately into the atmosphere in the form of plant respiration. The other half is converted into biomass (leaves, wood, roots, etc.) that ends up on or in the ground.
The study of Jae-Seok Lee (2011)[8] shows that the soil emission is strongly dependent on temperature. Lee’s graph (Figure 4) shows that there is an exponential relationship between soil temperature and emission. A 1 °C increase in soil with a temperature of 14 °C leads to 15% to 20% higher emissions.

A 2016 study by Zhang et al.[13] found that emissions in China from the soil had increased by an average of 28% over 50 years. If China is representative for the rest of the world, the increase in soil emissions is about 17 PgC/yr. This is greater but still comparable to the IPCC’s 11.6 PgC/yr.
The absorption of CO₂ on land has also increased. The world has become greener under the influence of the higher CO₂ concentration (Figure 5, left). According to NASA[14], the greening has resulted in an increase in plants and trees over an area equivalent to twice the size of the United States.
A 2017 study by Peng Li[11] has shown that the Net Primary Production (NPP) has grown by 11.8 PgC/yr since 1960 (Figure 5, right). The NPP is the amount of CO₂ converted to biomass by plants (during photosynthesis) minus the plant respiration. The growth of the NPP illustrates that the absorption on land has increased and confirms the aforementioned figures from the IPCC.
So also for land it is clear that temperature plays an important role in the rise of the CO₂ fluxes. The increase of the land fluxes is not related to human emissions, but can be well explained by the global warming of 1 °C. The absorption of CO₂ on land has increased as a result of the global greening, under the influence of the higher atmospheric CO₂-concentration.
- The growth of the natural fluxes can only take place at a higher concentration in the atmosphere
So the increase in flows to and from land and sea has natural causes. Emissions from the sea and the soil respiration are temperature sensitive. Due to the increase in the average global temperature of about 1 °C, these flows have grown by about 30 PgC/yr since 1750.
The absorption flows have also increased, with concentration being the driving factor. At sea, absorption increases with a higher concentration in the atmosphere based on Henry’s Law. On land, the higher CO₂-concentration makes the earth greener: plants grow faster when there is more CO₂. This causes a higher NPP (Net Primary Production) and therefore more absorption.
Or to put it in another way: the larger down-fluxes to land and sea are only possible due to higher concentration in the atmosphere. Also in a situation with no human emissions at all, but still a similar temperature rise (like e.g. in the Middle Ages), the CO₂ concentration would have to go up.
The following graph (Figure 6) shows again the main atmospheric flows, but now with the main driving forces.
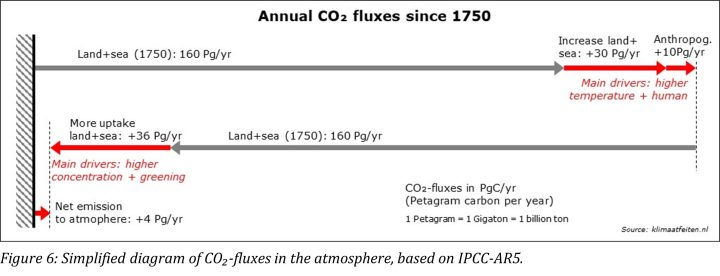
It’s also obvious from this picture that it makes no sense to assume that human CO₂ accumulates in the atmosphere, as the IPCC says. It would be very illogical if the down-flux under the influence of the higher concentration does increase for natural CO₂, but not for human CO₂. Nature does not distinguish between human CO₂ molecules and natural ones.
The IPCC still makes a distinction between residence time and adjustment time, where the adjustment time is defined as the time for atmospheric CO₂ to re-equilibrate following a perturbation. In their view the adjustment time is much longer than the residence time. But such a distinction makes no sense as all the (natural) sinks treat all CO₂-molecules in the same way. If the oceans can absorb more CO₂ based on Henry’s law, they will do that for both natural and human CO₂. The fact that in the ocean all sorts of biological and chemical processes take place is perhaps interesting, but not at all relevant. There is no separate drain for human CO₂.
To summarize:
- The 1 °C increase in the average global temperature has resulted in a higher annual natural emissions from land and sea.
- This increase in natural emissions is also visible in figure 6.1 of AR5 (+30 PgC/yr).
- The increase in both natural and anthropogenic emissions has led to more CO₂ in the atmosphere.
- The higher concentration results in a greater down-flux to both sea and land.
- The increase in concentration in the atmosphere is the result of a combination of increased temperature and human emissions.
The calculated impact of human emissions
In 2019 Hermann Harde[5] worked out a calculation model to determine how great the influence of humans is on the rise in CO₂ and how great the influence of temperature is. In doing so, he applied the following principles:
- The CO₂ concentration in 1880 was 280 ppm (parts per million).
- Human emissions have gradually increased to 10 PgC/yr (based on emissions data).
- The flow of CO₂ from land and oceans to the atmosphere has increased proportionally with the increase in temperature.
- The annual absorption of CO₂ in is proportional to the concentration in the atmosphere. There is only one residence time for all CO₂.
It turns out that this simple model does an excellent job in describing the increased concentration in the atmosphere and also provides logical explanations for all the other observations made so far. In the following chart (Figure 7), the blue line shows the concentration increase due to anthropogenic emissions (human CO₂) and the purple line the concentration increase due to emissions due to increased temperature. The green line is the sum of the two. The green line corresponds well with the measurements in Mauna Loa (blue blocks).

It turns out that the impact human emissions on the CO₂-concentration is relatively small. In his calculations, only 17 ppm (less than 15%) of the total increase is due to human CO₂. The vast majority of the increase is the result of the increased global temperature.
The good correlation in the chart in Figure 7 is of course no proof of Harde’s model. As to speak with Richard Feynman: “We can’t prove anything. We can only disprove something.”. But at least his model is in line with the observed drivers of natural emissions and absorptions and similar to many other well-known physical processes. Unfortunately, that cannot be said about the standard model the IPCC is using.
References
- Chen et al.: China and India lead in greening of the world through land-use management, 2019.
- Friedlingstein et al., Global Carbon Budget 2020, 2020
- Harde: Scrutinizing the carbon cycle and CO2 residence time in the atmosphere, 2017
- Harde: Reply to Comment on “Scrutinizing the carbon cycle and CO2 residence time in the atmosphere”, 2017
- Harde: What Humans Contribute to Atmospheric CO2: Comparison of Carbon Cycle Models with Observations, 2019.
- IPCC: Fifth Assessment Report, 2013
- Jaworowski: CO2: The Greatest Scientific Scandal of Our Time, 2007
- Lee: Monitoring soil respiration using an automatic operating chamber in a Gwangneung temperate deciduous forest, 2011.
- Murray Salby presentation in Hamburg: What is Really Behind the Increase of Atmospheric CO2?, 2018
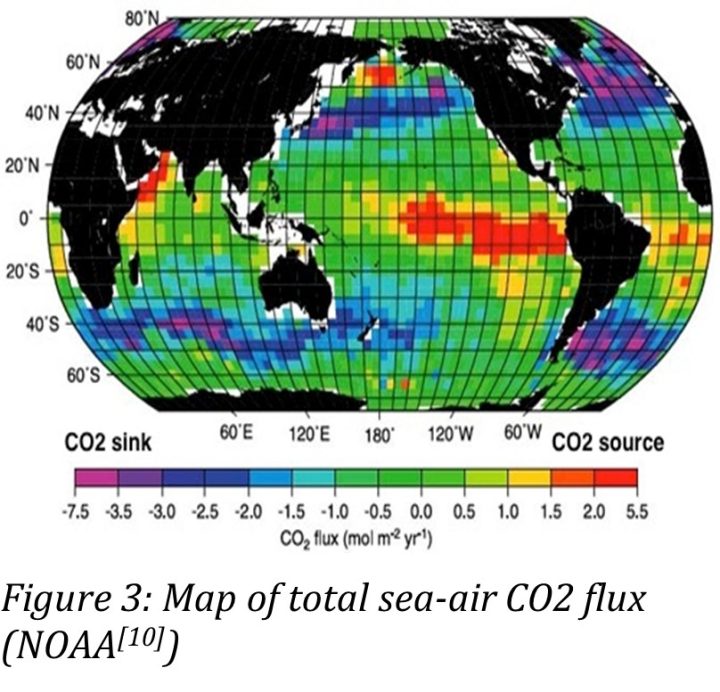
- NOAA, National Centers for Environmental Information: Map of Total Sea-Air CO2 flux
- Peng Li et al.: Quantification of the response of global terrestrial net primary production to multifactor global change, 2017.
- Stauffer, Berner: CO₂ in natural ice, 1978
- Zhang et al.: Rising soil temperature in China and its potential ecological impact, 2016.
- NASA: Carbon Dioxide Fertilization Greening Earth, Study Finds (website)