The Week That Was: 2022-04-16 (April 16, 2022)
Brought to You by SEPP (www.SEPP.org)
The Science and Environmental Policy Project
Quote of the Week: “For a successful technology, reality must take precedence over public relations, for Nature cannot be fooled.” – Richard Feynman, conclusion to his report on the Challenger disaster.
Number of the Week: $94.8 Trillion
THIS WEEK:
By Ken Haapala, President, Science and Environmental Policy Project (SEPP)
Scope: TWTW will discuss Roy Spencer’s estimate of the human contribution of carbon dioxide (CO2) as measured by the noted measuring facility on Mauna Loa mountain in Hawaii. The issues Spencer brings up apply to other efforts to establish causation through the use of statistics as well.
Over the past few months TWTW may have inadvertently implied that oceanic and atmospheric convection are not vital to the earth’s climate system, as discussed below.
Emeritus Professor of Physical Geography Ole Humlum wrote a report on the current state of the climate based on observations, not global climate models. Key points are presented.
Thanks to a shoddy survey, the Great Barrier Reef is dying again. Marine biologist Walter Starck and Jennifer Marohasy present evidence that it is not, exposing the shoddy survey.
Explained below, North America can become the energy arsenal of democracy, if Washington gets out of the way.
***************
Limits in Statistics: As Richard Feynman stated: “If there is something very slightly wrong in our definition of the theories, then the full mathematical rigor may convert these errors into ridiculous conclusions.” (TWTW, Mar 26). Such errors often result from overreliance on statistics. A real problem arises when politicized scientist, bureaucrats, and politicians claim the ridiculous conclusions are science facts, the same as physical evidence. On his web site Roy Spencer discusses such a problem when “Explaining Mauna Loa CO2 Increases with Anthropogenic and Natural Influences.” He writes:
“SUMMARY
“The proper way of looking for causal relationships between time series data (e.g., between atmospheric CO2 and temperature) is discussed. While statistical analysis alone is unlikely to provide ‘proof’ of causation, use of the ‘master equation’ is shown to avoid common pitfalls. Correlation analysis of natural and anthropogenic forcings with year-on-year changes in Mauna Loa CO2 suggest a role for increasing global temperature at least partially explaining observed changes in CO2, but purely statistical analysis cannot tie down the magnitude. One statistically based model using anthropogenic and natural forcings suggests ~15% of the rise in CO2 being due to natural factors, with an excellent match between model and observations for the COVID-19 related downturn in global economic activity in 2020.” [Boldface added]
Spencer explains the observations at Mauna Loa, then using differential calculus develops a “Master Equation” to infer (suggest) causation. This is separate from proving it. Proof requires physical evidence. Differential calculus computes the rate of change in one trend (phenomenon) of interest with the rate of change of another trend or phenomenon. Since the time of Newton, it is commonly used in physics such as calculating the orbits of the planets.
Spencer then goes through several attempts to correlate the changes in CO2 with changes in other trends:
“Global anthropogenic emissions, tropical sea surface temperature (ERSST), global average surface temperature (HadCRUT4), the Atlantic Multi-decadal Oscillation (AMO), the Indian Ocean Dipole (IOD), the Multivariate ENSO Index (MEI), Mauna Loa atmospheric transmission (mostly major volcanoes), the Pacific Decadal Oscillation (PDO), and the North Atlantic Oscillation (NAO).”
He writes further:
“The first thing we notice is that the highest correlation is achieved with the surface temperature datasets, (tropical SST or global land+ocean HadCRUT4). This suggests at least some role for increasing surface temperatures causing increasing CO2, especially since if I turn the causation around (correlate dSST/dt [change in sea surface temperature over time] with CO2), I get a very low correlation, 0.05.
“Next, we see that the yearly estimates of global anthropogenic CO2 emissions are also highly correlated with dCO2/dt [change in CO2 over change in time]. You might wonder, if the IPCC is correct and all of the CO2 increase has been due to anthropogenic emissions, why doesn’t it have the highest correlation? The answer could be as simple as noise in the data, especially considering the emissions estimates from China (the largest emitter) are quite uncertain.” [Boldface added]
Here is a major problem is using land-based surface temperature data used by many global climate modelers – it is extremely noisy because the effects of urbanization have not been removed. Many developing countries are experiencing intense urbanization as populations move from rural areas seeking a better way of life. Further, in developed countries much of the data is from airports, which have experience intense urbanization. Failure to remove the effects of urbanization results in ridiculous conclusions from global climate models.
Spencer concludes:
“The Mauna Loa CO2 data need to be converted to year-to-year changes before being empirically compared to other variables to ferret out possible causal mechanisms. This in effect uses the ‘master equation’ (a time differential equation) which is the basis of many physically based treatments of physical systems. It, in effect, removes the linear trend in the dependent variable from the correlation analysis, and trends by themselves have no utility in determining cause-versus-effect from purely statistical analyses. [Boldface added]
“When the CO2 data are analyzed in this way, the greatest correlations are found with global (or tropical) surface temperature changes and estimated yearly anthropogenic emissions. Curiously, reversing the direction of causation between surface temperature and CO2 (yearly changes in SST [dSST/dt] being caused by increasing CO2) yields a very low correlation.
“Using a regression model that has one anthropogenic source term and three natural forcing terms, a high level of agreement between model and observations is found, including during the COVID-19 year of 2020 when global CO2 emissions were reduced by about 6%.” See link under Challenging the Orthodoxy.
***************
Additions and Corrections – Convection: Over the past few months TWTW has focused on the work of Atomic, Molecular, and Optical physicists W. A. van Wijngaarden & W. Happer and extensions of this work by Howard Hayden to develop ten essays on Basic Climate Physics, posted on the SEPP website. This focus may give readers the false impression that a one-dimension model of outgoing radiation can describe the climate. That was not the intent.
The earth’s climate is a complex three-dimensional system where convection plays an important role in transporting heat to the tropopause where water vapor freezes out. Above the tropopause, infrared radiation more readily escapes into space. Also, atmospheric and oceanic convection transport heat from the tropics towards the poles. For example, the calculations van Wijngaarden & Happer are supported by observations over the Antarctic. There is more infrared radiation escaping from the top of the atmosphere than can justified by the surface temperature using the Stefan-Boltzmann law. This is from the atmosphere over Antarctica being warmer than the surface due to atmospheric convection.
Over the next several weeks, TWTW will endeavor to explain that convection is very important for the earth’s climate system, and that increasing greenhouse gases play a small role in this complex system. See http://www.sepp.org/science_papers.cfm.
***************
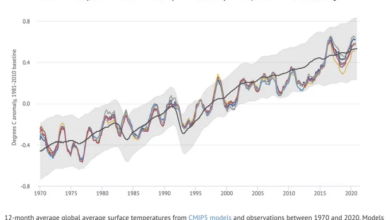
Observations, Not Imagination: In “The State of the Climate, 2021” published by the Global Warming Policy Foundation, Ole Humlum writes:
“This report has its main focus on observations and not on the output of numerical models, with the exception of Figure 39 (see p.38). References and data sources are listed at the end of the report”
The former Professor of Physical Geography at the University Centre in Svalbard, Norway, and Emeritus Professor of Physical Geography, University of Oslo, Norway, discusses air temperatures; oceans; sea level; sea ice; snow cover; and storms and hurricanes. Regarding air temperatures, he writes:
“Many figures in this report focus on the period since 1979 – the satellite era – when access to a wide range of observations with nearly global coverage, including temperature, became commonplace. These data provide a detailed view into temperature changes over time at different altitudes in the atmosphere. Among other phenomena, these observations reveal that a Stratospheric temperature plateau has prevailed since 1995.
“Since 1979, lower Troposphere temperatures have increased over both land and oceans, but most clearly over the land. The most straightforward explanation for this is that much of the warming is caused by solar insolation, but there may be several secondary reasons, such as changes in cloud cover and land use.”
For oceans he focuses on the Argo Program:
The Argo Program, which uses robotic floats to monitor ocean temperatures around the globe, and at different depths, has now achieved 18 years of global coverage, growing from a relatively sparse array of 1000 floats in 2004 to more than 3900 in December 2021. Since 2004, these floats have provided a unique ocean temperature dataset for depths down to 1900m. The data is currently updated to August 2020.
Although the oceans are much deeper than 1900m, and the published Argo data series still is relatively short, interesting features are now emerging from these observations. For example, since 2004, the upper 1900m of the oceans have experienced a globally averaged net warming of about 0.07°C. The maximum net warming (about 0.2°C) affects the uppermost 100m, mainly near the Equator, where the greatest amount of solar radiation is received.
He recognizes that a careful examination of the details is needed as more data comes in. He then discusses the problem of sea level:
“Global sea level is monitored by satellite altimetry and by direct measurement using tide gauges. While the satellite record suggests a global sea-level rise of about 3.3mm per year or more, data from tide gauges all over the world suggest a stable rise of 1–2mm per year. The tide gauges indicate no recent acceleration (or deceleration) of sea-level rise. The marked difference (a ratio of about 1:2) between the two datasets has no universally accepted explanation, but it is known that the satellite observations face complications in areas near the coast (see, for example, Vignudelli et al. 2019). Whatever the truth, the tide-gauge data are more relevant for local coastal planning purposes”
In the Climate Symposium 2020, the late Tom Wysmuller of the Right Climate Stuff Team recognized the 1 to 2 ratio and stated it was from a programming error in calculating sea levels from satellite altimetry. Interestingly, NASA emphasizes the observations from space on sea levels and ignores observations from space on temperatures. Selective science?
On issues such as sea ice, snow cover, and storms and hurricanes there are no general trends outside of what is considered to be normal. In short, the “climate crisis” appears to be man-made by politicians and politicized scientists, not based on physical evidence. See links under Challenging the Orthodoxy and https://therightclimatestuff.com/oct2020-symposium/.
***************
The Great Barrier Reef: The Great Barrier Reef (GBR) is an important symbol for Australia, and it has been as distorted by Australian climate scientists as Arctic melting and polar bear extinction have been distorted by Arctic climate scientists. Writing in Quadrant, marine biologist Walter Starck gives an overview of the GBR and how algal life quickly changes with changing weather, without permanently affecting the living coral. He begins with some readily verifiable facts:
1/ Tropical ocean waters are generally nutrient poor and the symbiotic algal cells which give corals their colors are living near the lower nutrient limits for healthy plant growth. Their metabolism is sensitive to temperature and to achieve high efficiency it is fine-tuned to an optimum temperature range of only few degrees. Different strains of the algae are optimized to the differing seasonal temperatures and geographic regions.
2/ The strains of algae living in the tissues of corals change in accord with seasonal changes in water temperature. Such changes are usually gradual and the change in algae is not visually apparent.
3/ However, a more rapid change in temperature can result in the existing algal strain being expelled from the corals and [the coral] appearing bleached. Such rapid changes in temperature are not rare. Atmospheric cold fronts can result in sudden cooling. Likewise, calm periods lasting a week or more in warmer months can result in several degrees of warming near the surface when wave-driven mixing and water flows across shallow reefs fade away.
4/ If a temperature change is only brief, as in the wind returning after a calm period, the expelled algal strain may just be re-established. If the change is seasonal, a new strain of algae may replace the previous one. Such recovery can be relatively quick. A few weeks after a bleaching event, corals usually appear normal again.
5/ Bleaching mostly affects shallow reef areas where it is also conspicuous. In deeper channels and on the edges of extensive shallow reef flats where tidal flow of warm water off shallow areas occurs, some bleaching may extend a few meters deeper. Extensive reef areas at depths below about 10 meters are generally unaffected. The vulnerable shallow areas are also subject to occasional devastation from storms, floods or even just a good rain if it occurs when corals are exposed by a low tide.
Unfortunately, news reports and unscrupulous scientists claim changes are permanent when they are not, including those from heat events. Indeed, GBR is not the most diverse coral reef,
“It is also worth noting that the average sea surface temperatures on the GBR are a couple of degrees cooler than they are in the Coral Triangle area of northern Indonesia and the southern Philippines, where coral reefs reach a peak of biodiversity [not] found anywhere [else] on Earth.”
In a pair of posts on her blog, Jennifer Marohasy provides photo evidence of the worse part of current coral bleaching that the GBR is not dying. As she states:
“It is a travesty and a tragedy that one of the most beautiful and biodiversity ecosystems on this Earth is being falsely reported as dying.”
On April 10 she went to John Brewer Reef, described as one of the worst bleached sections. She found:
“There was some bleaching, especially around the perimeter of John Brewer Reef – on the sandy sea floor where the Australian Institute of Marine Science (AIMS) surveyed and concluded coral cover is never more than 30% – but most of John Brewer Reef is still covered in more than 80% colorful corals. This high percentage is denied by AIMS because they never survey the reef crest.”
It appears that relying on reports of the Australian Institute of Marine Science (AIMS) is similar to relying on reports claiming dying grasslands from those who tour only the edge of the desert. See links under Challenging the Orthodoxy – Great Barrier Reef
***************
The Energy Crisis? Benny Peiser of the Global Warming Policy Foundation and Net Zero Watch is speaking in Australia. See Challenging the Orthodoxy.
***************
Arsenal of Democracy: Donn Dears brings up that thanks to its industrial strength, during World War II, the United States was considered the Arsenal of Democracy. Now, thanks to its oil and gas resources, greatly expanded by hydraulic fracturing and directional drilling it can be considered the Energy Arsenal of Democracy. TWTW adds Canada because US refineries are dependent on heavy crude for efficient refining to all necessary products. According to the EIA:
“In 2021, the United States imported about 8.47 million barrels per day (b/d) of petroleum from 73 countries. Petroleum includes crude oil, hydrocarbon gas liquids (HGLs), refined petroleum products such as gasoline and diesel fuel, and biofuels. Crude oil imports of about 6.11 million b/d accounted for about 72% of U.S. total gross petroleum imports in 2021, and non-crude oil petroleum accounted for about 28% of U.S. total gross petroleum imports.
“In 2021, the United States exported about 8.63 million b/d of petroleum to 176 countries and 4 U.S. territories. Crude oil exports of about 2.98 million b/d accounted for 35% of total U.S. gross petroleum exports in 2021. The resulting total net petroleum imports (imports minus exports) were about -0.16 million b/d in 2021, which means that the United States was a net petroleum exporter of 0.16 million b/d in 2021.
“The top five source countries of U.S. gross petroleum imports in 2021 were Canada (51%), Mexico (8%), Russia (8%), Saudi Arabia (5%), and Colombia (2%).”
Exports to Mexico exceeded imports from Mexico. With Canada and Mexico, North America can be energy independent of authoritarian governments. The question is when will Washington and the Canadian Prime Minister stop using false claims of dangerous global warming based on shoddy studies by the UN to cripple the vibrant fossil fuel industries?
See links under Challenging the Orthodoxy, Defending the Orthodoxy, Change in US Administrations, Energy Issues – US, Oil and Natural Gas – the Future or the Past?
***************
SEPP’S APRIL FOOLS AWARD – THE JACKSON
SEPP is conducting its annual vote for the recipient of the coveted trophy, The Jackson, a lump of coal. Readers are asked to nominate and vote for who they think is most deserving. The entire Biden Administration won in 2021, so individuals in it are still eligible.
The voting will close on July 30. Please send your nominee and a brief reason the person is qualified for the honor to [email protected]. The awardee will be announced at the annual meeting of the Doctors for Disaster Preparedness on August 14 to 16.
***************
Number of the Week: $94.8 Trillion: According to accountant Paul Homewood,
“Eight emerging markets — India, China, Indonesia, Kenya, South Africa, UAE, Nigeria, and South Africa [South Africa repeated] — will together need $94.8 trillion in transition finance from developed markets if they are to meet climate goals.
“India will need investments worth $12.4 trillion, nearly half of U.S. GDP, from developed nations and investors to help its economy transition to net-zero carbon emissions by 2060, according to a report. Without capital inflows and grants from the developed world, emerging economies including India’s will see household consumption fall by 5% on average each year, according to a study by Standard Chartered Plc.”
At the time of the Paris Agreement, the UN claimed it would need $100 Billion per year. Now it is $100 Billion a year for a thousand years? The next time John Kerry berates politicians in Indonesia to leave coal in the ground, as he did when he was Secretary of State under Obama, will he bring his personal checkbook?
Commentary: Is the Sun Rising?
Experts Adrift: Solar Cycle 25 more active than expected
By Jo Nova, Her Blog, Apr 10, 2022
African Research on Solar Cycles: Science vs. Net Zero
By James Wanliss, Master Resource, April 12, 2022
“Climate change is no hoax, because the climate always changes. Modest global warming might be beneficial for the globe. But not all climate change is beneficial. Cooling would be disastrous. This is especially so because, in a staggering display of wishful thinking, politicians continue to drain vast sums of national treasure to fund so-called alternative energy schemes.”
“The Nigerian paper argues that the modest warming over the past hundred years or so is largely due to natural phenomena.”
Censorship
Progressives Terrified By Free Speech
By Tony Heller, His Blog, Apr 14, 2022
https://realclimatescience.com/2022/04/progressives-terrified-by-free-speech/
“a nation that is afraid to let its people judge the truth and falsehood in an open market is a nation that is afraid of its people.”–John F. Kennedy
Challenging the Orthodoxy — NIPCC
Climate Change Reconsidered II: Physical Science
Idso, Carter, and Singer, Lead Authors/Editors, Nongovernmental International Panel on Climate Change (NIPCC), 2013
Summary: https://www.heartland.org/_template-assets/documents/CCR/CCR-II/Summary-for-Policymakers.pdf
Climate Change Reconsidered II: Biological Impacts
Idso, Idso, Carter, and Singer, Lead Authors/Editors, Nongovernmental International Panel on Climate Change (NIPCC), 2014
http://climatechangereconsidered.org/climate-change-reconsidered-ii-biological-impacts/
Summary: https://www.heartland.org/media-library/pdfs/CCR-IIb/Summary-for-Policymakers.pdf
Climate Change Reconsidered II: Fossil Fuels
By Multiple Authors, Bezdek, Idso, Legates, and Singer eds., Nongovernmental International Panel on Climate Change, April 2019
http://store.heartland.org/shop/ccr-ii-fossil-fuels/
Download with no charge:
Why Scientists Disagree About Global Warming
The NIPCC Report on the Scientific Consensus
By Craig D. Idso, Robert M. Carter, and S. Fred Singer, Nongovernmental International Panel on Climate Change (NIPCC), Nov 23, 2015
http://climatechangereconsidered.org/
Download with no charge:
https://www.heartland.org/policy-documents/why-scientists-disagree-about-global-warming
Nature, Not Human Activity, Rules the Climate
S. Fred Singer, Editor, NIPCC, 2008
http://www.sepp.org/publications/nipcc_final.pdf
Global Sea-Level Rise: An Evaluation of the Data
By Craig D. Idso, David Legates, and S. Fred Singer, Heartland Policy Brief, May 20, 2019
Explaining Mauna Loa CO2 Increases with Anthropogenic and Natural Influences
By Roy Spencer, His Blog, Apr 9, 2022
The State of the Climate 2021
By Ole Humlum, GWPF, 2022
https://www.thegwpf.org/content/uploads/2022/04/Humlum-State-of-Climate-2021-.pdf?mc_cid=2b0d86682b&mc_eid=4961da7cb1
Where have all the Clouds gone and why care?
By Charles Blaisdell, WUWT, Apr 13, 2022
[SEPP Comment: The work of W. A. van Wijngaarden & W. Happer is for a cloud-free atmosphere and is devoted to the matter of radiative forcing (RF The work of Howard Hayden shows that the average surface temperature depends on three variables: solar intensity, the greenhouse effect (of which radiative forcing is an incremental change), and the albedo. Blaisdell notes that IPCC tries to blame temperature changes on RF, whereas measured decreases in albedo are correlated with measured surface temperature increases. IPCC cannot account for increased surface IR emission, and blithely assumes slightly increasing albedo.]
The History of the Linear No-Threshold (LNT) Model Episode Guide
The Health Physics Society (HPS) created this series of videos to examine the history of the most controversial question in our field: the LNT model. Click on the episode numbers to view the videos.
Videos featuring Dr. Edward Calabrese, Accessed April 12, 2022
http://hps.org/hpspublications/historylnt/episodeguide.html
Don’t miss Benny Peiser speaking in Australia: The Energy Crisis
Press Release, Australian Environment Foundation, Via Jo Nova’s Blog, Apr 13, 2022
Is There Anyone Taking This Green Energy Transition Thing Seriously?
By Francis Menton, Manhattan Contrarian, Apr 13, 2022
https://www.manhattancontrarian.com/blog/2022-4-13-is-there-anyone-taking-this-green-energy-transition-thing-seriously
The Future Of Energy In The U.S.: Which Projection Do You Believe?
By Francis Menton, Manhattan Contrarian, Apr 10, 2022
https://www.manhattancontrarian.com/blog/2022-4-10-the-future-of-energy-in-the-us-which-projection-do-you-believe
“And by various Executive Orders, Biden has the whole federal bureaucracy committed to the fossil fuel suppression project, from stopping drilling to blocking pipelines to decommissioning power plants.”
“And it goes without saying that the world of academia has joined Side One with full unanimity. After all, these are the ‘smartest’ people; and the ‘smartest’ people all know that the ‘climate crisis’ can only be solved by suppressing fossil fuels.”
Challenging the Orthodoxy – Great Barrier Reef
The Nature of Things: Trees Shed Leaves, Coral Bleaches
By Walter Starck, Quadrant, Apr 16, 2022
Epicentre of Mass Coral Bleaching – Still So Beautiful (Part 1)
By Jennifer Marohasy, Her Blog, Apr 11, 2022
Leonard Lim’s Exquisite Photography of John Brewer Reef
By Jennifer Marohasy, Her Blog, Apr 14, 2022
Defending the Orthodoxy
“I campaign for the extinction of the human race” (Les Knight’s ultimate solution to climate change)
By Robert Bradley Jr., Master Resource, April 14, 2022
IPCC scientists say it’s ‘now or never’ to limit warming
By Paul Homewood, Not a Lot of People Know That, Apr 10, 2022
“But the real objective of the UN is revealed by our old friend Jim Skea. co-chair of this IPCC Working Group and longtime member of the Committee on Climate Change:
“’Climate change is the result of more than a century of unsustan=inable energy and land use, lifestyles and patterns of consumption and production’’ said Skea. ‘This report shows how taking action now can move us towards a fairer, more sustainable world.’”
https://www.ipcc.ch/report/ar6/wg3/resources/press
“Translation- ‘We in the West are consuming far too much, and it is not fair that we are richer than the rest of the world. We must make you poorer’”
Part 3 Of IPCC’s 6th Climate Report Gets Mixed Reaction From The European Media, Not All Pessimistic
By P Gosselin, By Die kalte Sonne, Via No Tricks Zone, Apr 9, 2022
My Views on Climate Change/Global Warming and A Cool/Showery Forecast for the Next Week
Several readers of this blog asked that I provide a summary of my views on global warming.
By Cliff Mass, Weather Blog, Apr 15, 2022
https://cliffmass.blogspot.com/2022/04/my-views-on-climate-changeglobal.html
Podcast and Text
[SEPP Comment: Disagree with allocating most of the 20th century warming to greenhouse gases.]
The latest last chance
By John Robson, Climate |Discussion Nexus, Apr 13, 2022
The IPCC has produced its latest brick, Climate Change 2022: Mitigation of Climate Change, aka the Working Group III component of its Sixth Assessment Report. And naturally it includes a brief (well, 64-page) Summary for Policymakers and a Technical Summary (145 pp.) because not even the authors’ mothers are going to read the full 2,913 page doorstopper. But before you rush to do so, let’s play a little game. Close your eyes and imagine what journalists were saying it said within hours of its appearance last week, namely before they too had read it. No, not “We’re all going to die.” That messaging, they have discovered, encourages fatalism and discourages people from bothering with the climate crusade. So this report takes a comparatively cheery tack: “We still have one last chance to save the planet, honest we do, for real this time. But only if, as usual, you give a lot more money and power to politicians.” There, we saved you having to read the rest.
Defending the Orthodoxy – Bandwagon Science
Interpreting extreme climate impacts from large ensemble simulations—are they unseen or unrealistic?
By T Kelder, et al. Environmental Research Letters, Mar 29, 2022
https://iopscience.iop.org/article/10.1088/1748-9326/ac5cf4
From the abstract: “Large-ensemble climate model simulations can provide deeper understanding of the characteristics and causes of extreme events than historical observations, due to their larger sample size.”
[SEPP Comment: They may also lead to more muddled or ridiculous conclusions.]
Speaking of messaging
By John Robson, Climate |Discussion Nexus, Apr 13, 2022
“As the Economist incautiously allowed, the drafting of the latest IPCC report was all about messaging. And it’s striking that the mainstream press, famous critics of the rich and powerful, all seemed to have the same messaging memo: neither doom nor complacency, but optimistic urgency. Hence The Guardian’s ‘The new IPCC report offers not only hope, but practical solutions. Governments that have signed off on it must now act’. And the New York Times. And Michael Mann, Gavin Schmidt, the Albuquerque Journal and everyone in between. Which for some reason gives the impression not of vigorous independent thought but of its habitual absence.”
Speaking of low confidence
By John Robson, Climate |Discussion Nexus, Apr 13, 2022
“t’s not immediately clear why the degree of agreement would be independent of the amount and quality of evidence, unless there’s this bogus consensus being manufactured somewhere and facts be hanged.”
There’s still a way to reach global goal on climate change
By Staff, AP, New York Post, Apr 14, 2022
https://nypost.com/2022/04/14/theres-still-a-way-to-reach-global-goal-on-climate-change/
“This 2 degree warmer world still represents what scientists characterize as a profoundly disrupted climate with fiercer storms, higher seas, animal and plant extinctions, disappearing coral, melting ice and more people dying from heat, smog and infectious disease. It’s not the goal that world leaders say they really want: 1.5 degrees Celsius (2.7 degrees Fahrenheit) since pre-industrial times.”
“In 2018 the United Nations’ scientific expert team studied the differences between the 1.5- and 2-degree thresholds and found considerably worse and more extensive damages to Earth at 2 degrees of warming. So the world has recently tried to make the 1.5 degrees goal possible.”
[SEPP Comment: Is total war with China the solution to this imaginary problem?]
The story of climate change right now in 9 charts
By Catherine Clifford, CNBC, Apr 5, 2022
https://www.cnbc.com/2022/04/05/ipcc-report-charts-detail-climate-change.html
[SEPP Comment: Based on IPCC models.]
Questioning the Orthodoxy
2 More New Studies Reaffirm The CO2-Drives-Climate-Change Paradigm Has A Magnitude Problem
By Kenneth Richard, No Tricks Zoner, Apr 14, 2022
Link to latest paper: High temporal variability of surface solar irradiance due to cloud enhancement effect over the Western Ghat mountains in peninsular India
By Padmakumari B. et al., Journal of Atmospheric and Solar-Terrestrial Physics, June 2022
https://www.sciencedirect.com/science/article/abs/pii/S1364682622000426
Link to other 2022 paper: Investigating the Impacts of Daytime Boundary Layer Clouds
on Surface Energy Fluxes and Boundary Layer Structure
During CHEESEHEAD19
By J. Sedla, et al., JGR Atmospheres, Feb 18, 2022
https://agupubs.onlinelibrary.wiley.com/doi/pdfdirect/10.1029/2021JD036060
Climate-Change ‘Solutions’ Way Worse Than the Problem
By Ron Clutz, Science Matters, Apr 15, 2022
New Study: Arctic Was Much Warmer 6000 Years Ago… 90% Of Glaciers, Ice Caps Smaller Than Present Or Absent!
By P Gosselin, No Tricks Zone, Apr 10, 2022
Link to paper: Arctic glaciers and ice caps through the Holocene:a circumpolar synthesis of lake-based reconstructions
By Laura J. Larocca and Yarrow Axford, Climate of the Past, Mar 30, 2022
https://cp.copernicus.org/articles/18/579/2022/
A bracing breeze on wind
By John Robson, Climate |Discussion Nexus, Apr 13, 2022
“Even if we were willing to grant the alarmists their premises, that there’s this huge man-made climate crisis and fossil fuels must go, and we ask what they propose we should do, if they rush to propose something as incredibly environmentally and economically harmful as wind, and they respond to the evidence of its utter failure to date with the demand that its usage should be expanded a hundred-fold, we can only despair at the prospect of a meeting of minds.”
Non-Serious Experts And World Leaders
By Tony Heller, His Blog, Apr 14, 2022
https://realclimatescience.com/2022/04/non-serious-experts-and-world-leaders/
The Battle for 1.5 Degrees of Warming Is Already Lost, So What’s Plan B?
By James E. Hanley, Cornwall Alliance, Apr 11, 2022
Energy and Environmental Review: April 11, 2022
By John Droz, Jr., Master Resource, April 11, 2022
NZ helped scrub ‘plant-based’ diets from IPCC climate report
By Kip Hansen, WUWT, Apr 12, 2022
After Paris!
Exit the Paris Climate Accord (Marlo Lewis on offense)
By Robert Bradley Jr, Master Resource, April 13, 2022
“The Paris Agreement is a signed but non-ratified treaty, and as such creates no legal obligations for the United States.”
White House climate adviser: “We can no longer wait” to cut emissions
By Andrew Freedman, Axios, Apr 5, 2022
https://www.axios.com/white-house-climate-adviser-zaidi-emissions-cuts-43f56578-c592-4104-947a-a79106b48d87.html
“Editor’s note: This story has been corrected to reflect that [White House deputy climate adviser Ali] Zaidi talked about people who reject climate science findings but did not single out Republicans.”
[SEPP Comment: What if the findings are imaginary?]
Now, What About Those 9,000 Unused Drilling Permits?
By Jane Shaw Stroup, The Environmental Blog, Apr 1, 2022
More Gasoline Gimmickry From the Biden Administration
By Benjamin Zycher, Real Clear Energy, April 14, 2022
https://www.realclearenergy.org/articles/2022/04/14/more_gasoline_gimmickry_from_the_biden_administration_827187.html
President Biden Should Own His Share of the Blame for High Prices at the Pump
By Kyle Isakower, Real Clear Energy, April 11, 2022
https://www.realclearenergy.org/articles/2022/04/11/president_biden_should_own_his_share_of_the_blame_for_high_prices_at_the_pump_826545.html
Russia’s Aggression Against Ukraine is Being Fed by America’s Lack of Energy Independence
By Jason Siegelin & Joe Bingham, Real Clear Energy, April 13, 2022
https://www.realclearenergy.org/articles/2022/04/13/russias_aggression_against_ukraine_is_being_fed_by_americas_lack_of_energy_independence_827010.html
Social Benefits of Carbon Dioxide
All this and CO2
By John Robson, Climate |Discussion Nexus, Apr 13, 2022
“He [Craig Idso] argues that CO2 provides enormous benefits that should be taken into account even by people who believe that it also carries significant costs. And nothing spoils a good debate like a quarrel over whether there’s any such thing as those ghastly tradeoffs in public policy generally and climate in particular.”
Problems in the Orthodoxy
The Magic And Mystery Of Turbulence
By Katie Spalding, IFLScience, Apr 6, 2022 [H/t Climate Etc.]
https://www.iflscience.com/physics/the-magic-and-mystery-of-turbulence/all/
Seeking a Common Ground
The West Is Suffering The Consequences Of Poor Energy Decisions
By Irina Slav, Oil Price.com, Apr 10, 2022
https://oilprice.com/Energy/Energy-General/The-West-Is-Suffering-The-Consequences-Of-Poor-Energy-Decisions.html
“The West is beginning its painful awakening to one very simple fact. This fact is that whoever controls the raw materials controls everything. And if those who control the raw materials play their cards right, they are likely to remain in control while the consumers of these raw materials deepen their dependence on these external suppliers.”
The Human Cost Of Moving Away From Fossil Fuels
The conversation about climate change needs to shift from simply reducing carbon emissions to ensuring that developing nations can take part in a diversified green economy.
By Devika Dutt and Alden Young, Noema, Apr 7, 2022
Model Issues
New evidence of climate model hot biases Part II
By John Robson, Climate |Discussion Nexus, Apr 13, 2022
Link to paper: Advanced Testing of Low, Medium, and High ECS CMIP6 GCM Simulations Versus ERA5-T2m
By Nicola Scafetta, Geophysical Research Letters, Mar 14, 2022
https://agupubs.onlinelibrary.wiley.com/doi/10.1029/2022GL097716
Quantifying CMIP6 model uncertainties in extreme precipitation projections
Amal John, Hervé Douville, Aurélien Ribes, Pascal You, Weather and Climate Extremes, June 2022
https://www.sciencedirect.com/science/article/pii/S2212094722000238
Measurement Issues — Surface
Messing With Texas
By Tony Heller, His Blog, Apr 14, 2022
https://realclimatescience.com/2022/04/messing-with-texas-4/
Changing Weather
The role of the Pacific Decadal Oscillation and ocean-atmosphere interactions in driving US temperature predictability
By Sem Vijverberg & Dim Coumou, npj Climate and Atmospheric Science, Mar 15, 2022 [H/t Climate Etc.]
https://www.nature.com/articles/s41612-022-00237-7
The Coldest Mid-April Period in Northwest History
We are in the middle of one of the extreme cold periods in Northwest history.
By Cliff Mass, Weather Blog, Apr 14, 2022
https://cliffmass.blogspot.com/2022/04/the-coldest-mid-april-period-in.html
The Great Portland/SW Washington Snowstorm of April 11, 2022
Portland residents will be telling their grandchildren about this one.
By Cliff Mass, Weather Blog, Apr 10, 2022
https://cliffmass.blogspot.com/2022/04/the-great-portlandsw-washington.html
Roaring And Screaming
By Willis Eschenbach, WUWT, Apr 15, 2022
Tornado Outbreak Of April 15, 1956
By Tony Heller, His Blog, Apr 15, 2022
https://realclimatescience.com/2022/04/tornado-outbreak-of-april-15-1956/
Tornado Outbreak Of April 15, 1921
By Tony Heller, His Blog, Apr 15, 2022
https://realclimatescience.com/2022/04/tornado-outbreak-of-april-15-1921/
Changing Climate
Would You Prefer With or Without Ice?
By Ron Clutz, Science Matters, Apr 14, 2022
Changing Climate – Cultures & Civilizations
Early human habitats linked to past climate shifts
Press Release, Institute for Basic Science, Apr 13, 2022 [H/t WUWT]
https://www.sciencedaily.com/releases/2022/04/220413131147.htm
Link to paper: Climate effects on archaic human habitats and species successions
By Axel Timmermann, et al. Nature, Apr 13, 2022
https://www.nature.com/articles/s41586-022-04600-9
Changing Seas
Don’t Look Up
By Paul Driessen, CFACT, Via ICECAP, Apr 10, 2022
http://icecap.us/index.php/go/new-and-cool/dont_look_up3/
“In the Chesapeake Bay area, subsidence averages nearly 3 mm/year; 11.5 inches per century. That’s in addition to almost 4.5 inches per century in isostatic subsidence, plus 7 to 9 inches per century in actual sea level rise. The total perceived sea level rise can be 24 inches per century – although two-thirds of that total has nothing to do with actual sea level rise. Indeed, the Norfolk Naval Station tide gauge at Sewell’s Point shows that the rate of actual sea level rise has not changed since the gauge was installed in 1927.”
CDN by the sea: Victoria BC
By John Robson, Climate |Discussion Nexus, Apr 13, 2022
Link to: Permanent Service for Mean Sea Level
By Staff, National Oceanography Centre, Liverpool, UK,
https://www.psmsl.org/
“If you’re one of those short-sighted people who thinks in terms of centuries rather than millennia, over the next 100 years the sea level at Victoria will rise by about 2.6 centimeters, which on the San Juan Islands just east of Victoria would be one inch. And if you think one inch of seawater is an existential threat, you shouldn’t be living near the shore. Or arguably without adult supervision anywhere.”
Changing Cryosphere – Land / Sea Ice
Newfoundland polar bear sighting updates and video
By Susan Crockford, Polar Bear Science, Apr 14, 2022
[SEPP Comment: Sure it’s not the roofer checking out the shingles?]
Another polar bear on Fogo, this time on the south shore as sea ice surrounds the island
By Susan Crockford, Polar Bear Science, Apr 10, 2022
Lowering Standards
Sorry, Nature, Associated Press, etc., Climate Change Is Not Making Hurricanes ‘Wetter’
By H. Sterling Burnett, Climate Realism, April 14, 2022
Australia’s Coal Conundrum: Economy, Climate at Odds
By Darrell Proctor, Power Mag, Apr 1, 2022
[SEPP Comment: A false dilemma typical of Power Mag.]
NPR Wrongly Blames Climate Change for Suffering Caused by Civil War, Corruption, and Weather
By Linnea Lueken, Climate Realism, April 7, 2022
Saving The Planet
By Paul Homewood, Not a Lot of People Know That, Apr 12, 2022
Communicating Better to the Public – Exaggerate, or be Vague?
Thirty Years of the ‘Now or Never’ Climate Cry
By Itxu Diaz, National Review, Apr 7, 2022
5 things to know about liquefied natural gas and its role in the Ukraine crisis
By Zack Budryk, The Hill, Apr 10, 2022
[SEPP Comment: It’s not Russian LNG to Europe that is the problem. It is pipeline gas, without expense of converting it to LNG for transport.]
Ocean life may adapt to climate change, but with hidden costs
Press Release, NSF, Apr 11, 2022
https://www.nsf.gov/discoveries/disc_summ.jsp?WT.mc_id=USNSF_1&cntn_id=304874&utm_medium=email&utm_source=govdelivery
Link to paper: Loss of transcriptional plasticity but sustained adaptive capacity after adaptation to global change conditions in a marine copepod
By Reid S. Brennan, et al. Nature Communications, Mar 3, 3033
https://www.nature.com/articles/s41467-022-28742-6
From abstract: “These results demonstrate that while plasticity facilitated initial survival in global change conditions, it eroded after 20 generations as populations adapted, limiting resilience to new stressors and previously benign environments.”
[SEPP Comment: If the copepod, Acartia tonsa,, is allowed to adapt to rising temperatures and increasing acidity, it does. But if suddenly transplanted to different temperature and acid levels, it doesn’t adapt.]
Communicating Better to the Public – Make things up.
Climate change caused more rain during 2020 hurricanes: study
By Rachel Frazin, The Hill, Apr 13, 2022
Link to paper Attribution of 2020 hurricane season extreme rainfall to human-induced climate change
By Kevin A. Reed et al. Nature Communications, Apr 12, 2022
https://www.nature.com/articles/s41467-022-29379-1
[SEPP Comment: Incredible! Comparing the 2020 season with what may have happened in 1850?]
PIK Researcher Stefan Rahmstorf Plays It Loose With His Sources, Mischaracterizes Wind Energy Drawbacks
Stefan Rahmstorf has problems with his sources
By Die kalte Sonne, Translated by No Tricks Zone, Apr 15, 2022
Expanding the Orthodoxy
Remarks by Chair Gensler Before the Ceres Investor Briefing
Posted by Gary Gensler, U.S. Securities and Exchange Commission, April 13, 2022
“The core bargain from the 1930s is that investors get to decide which risks to take, as long as public companies provide full and fair disclosure and are truthful in those disclosures.
“Over the generations, the SEC has stepped in when there’s significant need for the disclosure of information relevant to investors’ decisions.”
[SEPP Comment: Now public companies must respond to imaginary risks dreamed up by government bureaucrats?
Just what we need
By John Robson, Climate |Discussion Nexus, Apr 13, 2022
“Or what it’s actually for, though according to Climate Home News it’s the ‘High-Level Expert Group on the Net-Zero Emissions Commitments of Non-State Entities (HLEG)’ and it will ‘be supported by a small full-time staff at the UN’s New York headquarters.’ As the UN defines these things, as in vaguely but to their own closed-door satisfaction.”
[SEPP Comment: More reasons why the UN is of little value to the public, particularly to the poor.]
Questioning European Green
Environmentalists Are Crushing Europe’s Energy Independence Ambitions
By ZeroHedge , Via Oil Price.com, Apr 10, 2022
https://oilprice.com/Energy/Energy-General/Environmentalists-Are-Crushing-Europes-Energy-Independence-Ambitions.html
“A true energy transition must be competitive, reliable, and cheap, not a tax-collection and looting machine. It must consider all technologies. More industry and fewer politics. More competition and less ideology.”
Questioning Green Elsewhere
How Big Green Undermines Pennsylvania’s Energy Potential
By Kevin Mooney, Real Clear Energy, April 14, 2022
https://www.realclearenergy.org/articles/2022/04/14/how_big_green_undermines_pennsylvanias_energy_potential_827185.html
“That’s well said. But the NRDC, with roughly $180 million in assets, and the Sierra Club, with more than $88 million in assets, are sure to play a prominent role in the upcoming elections. Both groups have repeatedly testified in favor of joining RGGI and both groups have the resources to drown out the voices of state residents who pine for American energy independence.”
[SEPP Comment: The numbers are dated. The 2020 IRS 990 for NRDC shows Assets of $442,842,000 and Revenue of $181,822,000. The 2020 IRS 990 for Sierra Club shows Assets of $129,884,000 and Revenue of $153,638,000
https://projects.propublica.org/nonprofits/display_990/132654926/05_2021_prefixes_13-13%2F132654926_202006_990_2021052018154031
https://www.sierraclub.org/sites/www.sierraclub.org/files/2020%20Sierra%20Club%20Public%20Disclosure%20990.pdf]
“Green” Dreams Kill People
By John Hinderaker, PowerLine, Apr 11, 2022
It’s Time for Transparency of The Embedded Costs of Going “Green”
By Ronald Stein, CFACT, Apr 12, 2022
https://www.cfact.org/2022/04/12/its-time-for-transparency-of-the-embedded-costs-of-going-green/
The Elite Think Climate Action is More Important than Your Ability to Pay Your Bills
By Eric Worrall, WUWT, Apr 11, 2022
Funding Issues
China & India need $50 trillion for Net-Zero transition, report says
By Paul Homewood, Not a Lot of People Know That, Apr 11, 2022
Real scientists dim view of the Oregonian
By Gordon Fulks and Chuck Wiese, Via ICECAP, Apr 14, 2022
http://icecap.us/index.php/go/joes-blog/real_scientists_dim_view_of_the_oregonian/
“Oregon State University has long received massive funding for their support of climate hysteria. The last I looked; the Federal Government gravy train leaves them upwards of $250 million dollars every year.”
Litigation Issues
UCLA ordered to release records showing coordination between law enforcement and ‘climate denialism’
By Christin Nielsen, Legal Newsline, Apr 15, 2022
https://legalnewsline.com/stories/623256609-ucla-ordered-to-release-records-showing-coordination-between-law-enforcement-and-climate-denialism
“As previously reported by Legal Newsline, the original PRA request was initiated after an agenda from a ‘secret meeting’ at Harvard University was released by the Vermont Office of the Attorney General. Documents show that UCLA faculty participated in the meeting alongside climate activists, potential funders and law enforcement officials.”
[SEPP Comment: Publicly funded corruption?]
Fuel Producers, States Challenge New EPA Rule Effectively Mandating Electric Vehicles
By Kevin Stone, Environment & Climate News, April 12, 2022
NY AG launches gas price gouging investigation into the oil industry
By Matt Egan, CNN. Apr 14, 2022
https://www.cnn.com/2022/04/14/energy/gas-price-gouging-investigation/index.html
[SEPP Comment: Is natural gas price gouging by the state politicians acceptable when they deny public access to low-cost gas?]
EPA and other Regulators on the March
Environmental Protection Agency’s Equity Action Plan
By Staff, EPA, April 2022
[SEPP Comment: In this wonderful array of executive orders, objectives, and priority actions there is no effort to assure affordable, reliable energy to the less fortunate, the poor. No doubt the warm feelings these actions create will keep them warm on cold nights.]
Highly anticipated EPA draft says formaldehyde causes cancer
By Sharon Udasin and Rachel Frazin, The Hill, Apr 14, 2022
“In response to the EPA’s draft, the American Chemistry Council trade group said it ‘strongly objects to this decision,’ stressing that the release ‘follows several unheeded calls by industry and lawmakers to address clear process deficiencies”’— such as transparency issues, bias and other ‘irregularities.’”
Energy Issues – Non-US
Largest CCGT Plant in Southeast Asia Now Fully Operational
By Darrell Proctor, Power Mag, Mar 31, 2022
Chinese Refiners Cut Output At An Alarming Rate
By Tsvetana Paraskova, Oil Price.com, Apr 14, 2022
https://oilprice.com/Energy/Crude-Oil/Chinese-Refiners-Cut-Output-At-An-Alarming-Rate.html
Energy Issues – Australia
Guest post by Rafe Champion. Energy security on the edge of a cliff
By Rafe Champion, Jo Nova’s Blog, Apr 15, 2022
[SEPP Comment: A real tipping point, not an imaginary one: a black-out followed by a black start.]
Guest post by Rafe Champion. Trouble in RE paradise
By Rafe Champion, Jo Nova’s Blog, Apr 15, 2022
US EIA Clarification: “How much petroleum does the United States import and export?
By Staff, EIA, Accessed Apr 14, 2022
https://www.eia.gov/tools/faqs/faq.php?id=727&t=6
America Needs Proactive Energy Solutions, Not False Allegations
By William Shughart II, Real Clear Energy, April 07, 2022
https://www.realclearenergy.org/articles/2022/04/07/america_needs_proactive_energy_solutions_not_false_recriminations_825953.html
How Much of the Grid Must Be Upgraded?
By Kip Hensen, WUWT, Apr 12, 2022
[SEPP Comment: Upgrades won’t help if wind and solar are relied upon and they produce no power.]
U.S. Energy Grid Faces Huge Problems Amid Push To ‘Electrify Everything’
By Leonard Hyman & William Tilles, Oil Price.com Apr 13, 2022
https://oilprice.com/Energy/Energy-General/US-Energy-Grid-Faces-Huge-Problems-Amid-Push-To-Electrify-Everything.html
Pipe Dreams: How America Is Energized
By Ron Clutz, Science Matters, Apr 14, 2022
“The reason that Boston was getting gas from Russia, for instance, was because the state of Massachusetts [and New York] refused to allow a pipeline to bring it from Pennsylvania. That’s the same reason, by the way, that, in January of 2022, the citizens of Boston … were paying 400% more for natural gas than those Pennsylvanians only 200 miles away — in the middle of a New England winter.”
Electrification Can Strengthen America’s Energy Security, But Requires New Focus on U.S. Rare Earth and Critical Mineral Supply Chains
By Debra Phillips, Real Clear Energy, April 13, 2022
https://www.realclearenergy.org/articles/2022/04/13/electrification_can_strengthen_americas_energy_security_but_requires_new_focus_on_us_rare_earth_and_critical_mineral_supply_chains_827007.html
Electrification Ignites Debate Over Future of Energy
By Darrell Proctor, Power Mag, Apr 1, 2022
[SEPP Comment: Brings up the interesting view that for the private citizen, buying an Electric Vehicle (EV) is like buying a large electric appliance. Unfortunately, it fails to discuss that solar and wind generation need significant back-up or storage. The costs of these are ignored. So is the disruption that distributive generation (local wind and solar) creates.]
Washington’s Control of Energy
Biden administration announces new oil, gas lease sales, royalty hike
By Zack Budryk, The Hill, Apr 15, 2022
“The Interior Department also announced a royalty hike, increasing rates from 12.5 to 18.75 percent.”
“Now it’s this proposal to dramatically increase the cost of onshore leases while cutting the acres offered for lease by 80 percent. The president claims he’s doing nothing to limit domestic production, but once again his administration is making American energy more expensive and harder to produce.” Senator Barrasso (R-Wyo)
Oil and Natural Gas – the Future or the Past?
America’s Natural Gas Juggernaut
By Gregory Wrightstone, CO2 Coalition, April 12, 2022
America’s LNG Export Potential
By Donn Dears, Power For USA, Apr 12, 2022
Haynesville Shale: Record Natural Gas Production
By David Middleton, WUWT, Apr 15, 2022
“The Haynesville Shale (technically Haynesville/Bossier) in northeast Texas and northwest Louisiana is the third largest natural gas play, in terms of production rate and proved reserves, in these United States.”
Column: U.S. gas storage emptied by exports to Europe and Asia
By John Kemp, Reuters, Apr 10, 2022
https://www.reuters.com/business/energy/us-gas-storage-emptied-by-exports-europe-asia-kemp-2022-04-08/
[SEPP Comment: Will Washington allow fast replenishment?]
Alternative, Green (“Clean”) Solar and Wind
‘We’re all in trouble’ – Wind turbine makers selling at a loss
By Paul Homewood, Not a Lot of People Know That, Apr 14, 2022
“More evidence that low wind prices at auctions are unsustainable:”
Texas Republicans: Backlash to Big Wind Brewing
By Robert Bradley Jr, Master Resource, Apr 15, 2022
Killing eagles is fine, just get your permit first
By Jo Nova, Her Blog, Apr 13, 2022
Alternative, Green (“Clean”) Energy — Other
Hydrogen 11 times worse than CO2 for climate, says new report
By Paul Homewood, Not a Lot of People Know That, Apr 14, 2022
Link to one report: Atmospheric implications of increased Hydrogen use
By Nicola Warwick et al. UK Government, April 2022
“’But when it’s released directly into the atmosphere, hydrogen itself can interact with other gases and vapors in the air to produce powerful warming effects. Indeed, a new UK Government study has put these interactions under the microscope and determined that hydrogen’s Global Warming Potential (GWP) is about twice as bad as previously understood; over a 100-year time period, a tonne of hydrogen in the atmosphere will warm the Earth some 11 times more than a tonne of CO2, with an uncertainty of ± 5.’”
“Why Shipping Pure Hydrogen Around The World Might Already Be Dead In The Water”
By P Gosselin, From Die kalte Sonne, Via No Tricks Zone, Apr 13, 2022
Link to article: SPECIAL REPORT: Why shipping pure hydrogen around the world might already be dead in the water
Physics and cost mean that ammonia is a far more economic option for long-distance seaborne transportation,
By Leigh Collins, Recharge News, Apr 4, 2022
https://www.rechargenews.com/energy-transition/special-report-why-shipping-pure-hydrogen-around-the-world-might-already-be-dead-in-the-water/2-1-1155434
Energy bills to rise in 2025 to pay for unproven hydrogen gas
By Paul Homewood, Not a Lot of People Know That, Apr 14, 2022
“What’s the definition of insanity?”
Alternative, Green (“Clean”) Vehicles
Electric Cars not Ready for Showtime
By William D. Balgord, American Thinker, Apr 13, 2022
https://www.americanthinker.com/articles/2022/04/electric_cars_not_ready_for_showtime.html
The End For Electric Cars? VW Develops New Hydrogen Technology: “2,000 Km On A Single Tank Of Fuel”!
By P Gosselin, No Tricks Zone, Apr 12, 2022
Only one electric car can beat ‘range anxiety’ and make it to the North–If you’ve got £100K!
By Paul Homewood, Not a Lot of People Know That, Apr 10, 2022
“’ More than 190,000 electric cars were sold in Britain last year and they accounted for about 11.6pc of total sales, according to the Society of Motor Manufacturers & Traders. However, there are still significant drawbacks to electric cars.’”
[SEPP Comment: The driving distance is roughly 666 kilometers (414 miles).]
California Dreaming
California proposes to triple electric vehicle sales by 2026
By Zack Budryk, The Hill, Apr 13, 2022
Other Scientific News
Monarch butterflies increasingly plagued by parasites
Press Release, NSF, Apr 11, 2022
https://www.nsf.gov/discoveries/disc_summ.jsp?WT.mc_id=USNSF_1&cntn_id=304875&utm_medium=email&utm_source=govdelivery
Link to paper:
Parasite dynamics in North American monarchs predicted by host density and seasonal migratory culling
By Ania A. Majewska, et al., Journal of Animal Ecology, Feb 16, 2022
https://besjournals.onlinelibrary.wiley.com/doi/abs/10.1111/1365-2656.13678
Other News that May Be of Interest
Extinction’s Yo-Yo – The Ivory-billed Woodpecker
By Kip Hansen, WUWT, Apr 14, 2022
The US Has an Opportunity to Lead on Aluminum
China and Russia are among the top producers, and neither is a good source.
By Jeb Nadaner, Industry Week, Apr 7, 2022
https://www.industryweek.com/the-economy/competitiveness/article/21238461/the-us-has-an-opportunity-to-lead-on-clean-aluminum-production
BELOW THE BOTTOM LINE
Ban fracking, rock concerts and football matches!
By David Whitehouse, Net Zero Watch, Apr 10, 2022
“According to the seismologist Alice Walker on the 8th August 1992 the police called the British Geological Survey saying that people had contacted them saying there had been an earthquake in London and did they know anything about it? It was reported that some people left tower blocks in fright. It was soon released that the cause of the earthquake was a concert by the pop group Madness in Finsbury Park.”
Ban European flights and car use in cities to hurt Putin, report urges
By Paul Homewood, Not a Lot of People Know That, Apr 15, 2022
Government’s Net Zero plan for tree planting may increase global warming, climate scientists find
Findings by an international team of climate scientists suggest that the government’s Net Zero project to plant millions of tree in Britain is likely to increase rather than decrease global temperature.
Press Release, Net Zero Watch, Apr 12, 2022
Link to paper: The Unseen Effects of Deforestation: Biophysical Effects on Climate
By Deborah Lawrence, et al., Frontiers in Forests and Global Change, Mar 24, 2022
https://www.frontiersin.org/articles/10.3389/ffgc.2022.756115/full
How To Save Energy
By Paul Homewood, Not a Lot of People Know That, Apr 10, 2022
[SEPP Comment: Back to the 1970s?]
Scientists Risk Arrest to Demand Climate Action
A growing international movement called Scientist Rebellion calls on world leaders to end the burning of fossil fuels
By Chelsea Harvey, E&E News, Scientific American, Apr 11, 2022
https://www.scientificamerican.com/article/scientists-risk-arrest-to-demand-climate-action/
Trudeau Meets Greta, Scorns Truckers
Canadian elites have declared war on ordinary people.
By Donna Laframboise, Big Picture News, Apr 15, 2022
ARTICLES
Why Arab Allies Don’t Trust the U.S. on Ukraine
‘This will not stand,’ the president said after Iraq invaded Kuwait. No such fortitude is evident today.
By Robert Satloff, WSJ, April 8, 2022
https://www.wsj.com/articles/arab-allies-dont-trust-the-us-ukraine-middle-east-resolve-russia-ukraine-arms-sales-saudi-arabia-uae-united-arab-emirates-libya-egypt-iraq-iran-nuclear-deal-jcpoa-2015-israel-11649446410?mod=opinion_major_pos5
TWTW Summary: After describing how many Americans are reacting to the Russian invasion of Ukraine, the executive director of the Washington Institute states:
“Many Arabs see it differently. They view America in 2022 through the lens of their experience over the past 30-plus years. For them, something is amiss.
“In 1990, when an Arab aggressor invaded his smaller, weaker neighbor—Saddam Hussein swallowing Kuwait—the response of the American president, George H.W. Bush, was to declare ‘this will not stand.’ He then orchestrated the greatest international coalition since World War II, including half a million U.S. troops, to expel the invader, restore Kuwait’s sovereignty and arrange for billions to rebuild the country. Arabs like to recall that when America showed steely resolve against aggression, their leaders responded to Washington’s call, both by contributing troops and by hosting coalition forces. It was the high moment of Arab confidence in America’s resolve.”
“Their more recent experience with America has left a bitter taste. They recite a list of complaints.
“This started with Barack Obama’s 2009 speech in Cairo, interpreted as offering an outstretched hand to the Muslim Brotherhood, which was followed by the decision to cast off Egypt’s Hosni Mubarak, America’s longest-serving Arab ally. It continued with Mr. Obama’s almost casual ceding of Syria to Russian control by refusing to enforce his own ‘red line’ against the use of chemical weapons. And it peaked with his counsel that Saudi Arabia, a decades long security partner, should learn to share the Middle East with the radical leaders of the Islamic Republic of Iran, with whom he negotiated a controversial agreement that rewarded Iran for postponing, but not abandoning, its nuclear ambitions.
“The Arabs’ list of complaints then moves to the mercurial years of Donald Trump, who talked about restoring partnerships with traditional friends but showed an ‘America first’ indifference when Iran attacked the largest oil-processing facility in Saudi Arabia.
“With the current administration, many Arabs point to multiple embarrassments. There is Iran’s practice of retaliating against Israeli attacks by targeting U.S. assets because it knows America won’t respond. Iran has reportedly secured unexpected concessions from U.S. diplomats at the still-inconclusive Vienna nuclear talks. Washington has limited its response to multiple Iranian missile and drone attacks on Saudi Arabia and the United Arab Emirates, refusing to impose any direct cost on Iran for its aggression.
“The result is that, in the eyes of many Arabs, America’s impressive military assets throughout the Middle East are a decoy that masks a withdrawal of commitment and resolve.
“When seeing America’s we’ll-fight-to-the-last-Ukrainian approach to Russian aggression, many Arabs conclude that the U.S. can’t be counted as a reliable security guarantor, and that nuclear weapons—which Russia has, Iraq didn’t and Ukraine gave up—make all the difference.
“Many add to this list the case of Libya’s Moammar Gadhafi. They note that he negotiated away his nuclear ambitions only to be removed from power and killed a few years later.
“To be sure, many of my Arab interlocutors have perfected the art of expressing grievance through historical cherry-picking: highlighting America’s inadequacies while sidestepping their own governments’ follies and self-inflicted wounds. The reality is more complicated, and no critique of American policy can justify indulgence of Russia’s criminal behavior or reluctance to lend assistance to the Ukrainian people.
“These Arabs have a point, however. If a U.S. president is unwilling to say in 2022 what his predecessor said in 1990, ‘this will not stand,’ it is not unreasonable to doubt American resolve and seek deterrence elsewhere.
“The serious ones know they won’t find it in Moscow or Beijing. Some may turn to Israel, which can certainly help, but that country of under 10 million people isn’t a superpower. The answer, if one exists, comes back to Washington.
“The U.S. needs to find a way to bolster these Arabs’ confidence in the strength of American resolve. In part, this means a willingness to operate in the Middle East the way Iran does, with force and intimidation as tools of diplomacy. And in our bilateral relations, this doesn’t mean allowing our friends to buy anything they want in the Pentagon catalogue, but it does mean letting them purchase more than defensive weaponry that does nothing to dissuade Iran.
“If we can’t do this, we should not be surprised to wake up one morning to find that some of these states have drawn the not-irrational conclusion that security can only be found in the pursuit of their own nuclear weapons. That’s a sobering lesson to take from Ukraine.”