JorieClarkaJeremy S.LittellbJay R.AldercNathanTeatsa
aNorthern Region, U.S. Forest Service, Missoula, MT, USA
bU.S. Department of Interior Alaska Climate Adaptation Science Center, U.S. Geological Survey, Anchorage, AK, USA
cU.S. Geological Survey, 104 CEOAS Admin Building, Oregon State University, Corvallis, OR 97331, USA
Received 28 July 2021, Revised 16 December 2021, Accepted 17 December 2021, Available online 22 December 2021.
https://doi.org/10.1016/j.crm.2021.100385
Under a Creative Commons license
Abstract
Anthropogenic climate change during the 21st century presents a significant challenge to the protection of cultural resources (CRs) on federal lands that encompass ∼ 28% of the U.S. In particular, CRs on this land base may be adversely affected by a wide range of climate-change hazards, including damage by sea-level rise, enhanced deterioration by increasing temperature and precipitation, and destruction by more-frequent and severe wildfire. Most current measures to manage the impacts of hazards on CRs use vulnerability assessments, but because these require that all CRs be treated as having an equal chance of being affected by climate-change hazards (i.e., equal exposure) across large landscapes, the cost and resources required for such analyses are overwhelming to land management agencies. Projections of changes in many hazards, however, show that the probability of hazard occurrence will be unevenly distributed on the landscape. Incorporating this information into a risk assessment thus allows CR managers to prioritize their efforts on assessing impacts to CRs in those areas where the probability of the hazard is greatest, thus increasing efficiency. We provide several heuristic examples of implementing the first part of a CR risk assessment by using 21st-century projections of several hazards most likely to adversely affect CRs on nine National Forests (NFs) managed by the U.S. Forest Service in northern Idaho and Montana. Overlaying the projected distribution of hazards on these NFs with the distribution of CRs identifies CR exposure that, with information on their vulnerability, is required to determine risk. Additional policy and field studies will be needed to determine how to prioritize those CRs that are most at risk according to their significance as well as identify how impacts can be reduced and managed through adaptation planning and implementation. Adaptation will follow the iterative risk management process particularly by improving projection resolution. Finer scale, process-based modeling informed by the highest priority CRs would also provide a means to assess various adaptation options that might change the estimated risk and increase the odds of CRs being as little affected as possible.
1. Introduction
By encompassing a broad range of categories and types, including diverse archaeological sites left by Indigenous peoples, structures built by Euroamerican explorers, pioneers, and prominent historical figures, and cultural landscapes that played a role in the mythology, religion, or history of a people, cultural resources (CRs) in the United States provide critical insights into the history and development of human activities and cultural traditions spanning thousands of years (Neumann et al., 2010). They are nonrenewable and, in many cases, their significance is based on their existing location. In this regard, they are particularly vulnerable to the impacts of climate change because they cannot adapt, they are irreplaceable, and significant site context and integrity is lost if they are altered or moved.
Federal and many state land-management agencies in the U.S. are tasked with protecting CRs from adverse effects that occur on their land base. Present and future anthropogenic climate change is widely recognized as posing a significant adverse effect to CRs (Colette, 2007, Fatoric and Seekamp, 2017a, Sabbioni et al., 2010, Sabbioni et al., 2009, Sesana et al., 2021). Responding to this threat from climate-change hazards such as wildfire, temperature extremes, and sea-level rise is particularly challenging for the tens of thousands of CRs on U.S. public lands where, under federal historic preservation laws, regulations, and policies that call for their protection and stewardship, new impacts from climate change will demand additional resources that will likely exceed current capacity of land-management agencies (Fatoric and Seekamp, 2017c, Sesana et al., 2018, Sesana et al., 2020, Xiao et al., 2021). It is thus imperative that management plans addressing impacts of climate change to CRs on public lands develop the most efficient strategies possible to assist with decision making, recognizing that the scale of the problem means that the loss of some CRs will be unavoidable (Heilen et al., 2018).
Here we outline a new strategy for developing a risk assessment for CRs and implementing it for CR management and adaptation. We then provide several heuristic examples of implementing this strategy that involve identifying the probability of several projected hazards occurring on nine National Forests (NFs) managed by the U.S. Forest Service that cover ∼ 24 million acres in the Rocky Mountains of northern Idaho and western Montana (Fig. 1). Our results demonstrate that this strategy will provide a more effective means for decision makers to manage CRs for climate-change impacts through adaptation.
2. Strategies for managing cultural resources for Climate-Change impacts
2.1. Existing strategies
Nearly all adverse effects to CRs that are currently considered are associated with activities such as resource extraction, construction, deferred maintenance, wildfire suppression, and post-fire rehabilitation. These activities often implement protocols to mitigate adverse effects that were either designed during pre-planning preparations or are based on experience working with CRs in contexts other than climate-change hazards. The specific actions used to mitigate adverse effects may change and adapt to incident conditions, but in all cases, protocols are based on past or present experience and can be considered as reactive adaptative strategies (Sesana et al., 2018). Some agencies may also apply forest-management practices such as fuels reduction to reduce the likelihood of wildfire in the coming years. We note, however, that while these activities have the added value of reducing impacts to CRs in the associated project areas, they are not uniformly applied across federal lands, they are not yet fully designed to address the specific impacts from anthropogenic climate change, and they do not assess risk.
Proactive adaptive strategies are designed to manage and adapt to potential adverse effects from future climate-change hazards (Sesana et al., 2018). Having this longer-term perspective provides CR managers with time to marshal their resources and strategically implement adaptation measures for exposed and vulnerable CRs, with the benefits of such proactive measures exceeding their costs (Lempert et al., 2018) as well as enabling land management agencies to meet their long-term CR stewardship responsibilities under federal law.
The current proactive strategy adopted by most federal land-management programs is centered on a vulnerability assessment (Halofsky et al., 2018a, Halofsky et al., 2018b, McNeeley et al., 2017, Rockman et al., 2016) (https://www.fs.usda.gov/managing-land/sc/vulnerability-assessments), which was a focus of the Third and Fourth Assessment Reports of the Intergovernmental Panel on Climate Change (IPCC) that addressed impacts, adaptation, and vulnerability (McCarthy et al., 2001, Schneider et al., 2007). Here the expected impact of climate change to a CR (e.g., its vulnerability) is determined by the nature and degree to which a CR is exposed to significant climatic variations (e.g., exposure) plus the degree to which a CR could be affected by climate change (e.g., sensitivity) minus the capacity of the CR to adapt (Fussel and Klein, 2006). Rockman et al. (2016) suggested that because most CRs are inanimate and thus have little capacity to adapt, management plans should consider adaptation separately, leaving a vulnerability assessment as just a function of exposure and sensitivity. Relatively few climate-change-related vulnerability assessments have been put into practice, however, in part because all CRs are often treated as having an equal chance of being affected by climate-change hazards (i.e., equal exposure) across large landscapes. Because every CR then needs to be evaluated for its sensitivity, the cost and resources required for such analyses are overwhelming to land management agencies.
2.2. Proposed strategy
We propose that framing these proactive measures in the context of a risk assessment will provide a more effective means for decision makers to manage CRs for climate-change impacts through adaptation. We adopt the risk assessment framework that became the focus of the most-recent IPCC reports addressing impacts, adaptation and vulnerability (Field et al., 2014, Field et al., 2012, Oppenheimer et al., 2014) as well as of the Fourth National [U.S.] Climate Assessment (Lempert et al., 2018, Reidmiller et al., 2018). The level of risk of climate-related impacts to CRs results from the interaction of the probability of occurrence of climate-change hazards with the exposure and vulnerability of the CR and “involves judgments about what is of value, ranking of priorities, and cost–benefit analyses” (Jay et al., 2018). Here exposure is considered separately from, rather than being part of, vulnerability, with the former now considered as the presence of CRs in places that could be adversely affected by a hazard and the latter being the characteristics of CRs that are sensitive to climate-change hazards (Oppenheimer et al., 2014).
A risk assessment then builds on a vulnerability assessment by considering how vulnerability and exposure interact with the probability of a hazard occurring to determine the level of risk that a CR has to climate change. For example, a wooden historic structure that occurs in a dense forest is vulnerable to wildfire, but if there is a low probability of wildfire occurring, then it has low exposure and is thus at lower risk than a similarly situated wooden structure occurring in an area with a high probability of wildfire. This contrasts with a vulnerability assessment which, by not accounting for the probability of wildfire occurring, would require that both structures be managed equally for the impacts from wildfire. The fact that climate-change hazards will be spatially heterogeneous as opposed to uniformly distributed thus makes a risk assessment particularly useful for prioritizing CRs for adaptation and management that would otherwise not be possible with a vulnerability assessment.
We outline a seven-step framework for developing a risk assessment for CRs and implementing it for CR management and adaptation, where the first four steps are required to define risk and the last three steps apply the assessment to address management and adaptation. The first step uses model projections to evaluate the probability of one or more climate-related hazards occurring on the landscape. Step 2 then involves assessing the level of exposure of CRs to the hazard, whereby CRs will have the greatest exposure when located in areas of greatest probability of a hazard. Once these CRs are identified, one assesses their level of vulnerability (step 3) from which the level of risk can then be established (step 4). Prioritizing CRs for adaptation, however, may require considering their cultural, scientific, or architectural significance in addition to their level of risk (step 5), which then guides decision making in the implementation of adaptation measures that reduce risk by reducing exposure and vulnerability (step 6). Adaptation measures are then reevaluated through iterative risk management that involves an ongoing process of assessment, action, monitoring, and reassessment as new information becomes available that will continue for decades or longer (step 7).
Protocols for evaluating vulnerability and significance and for implementing adaptation measures (with attendant budgetary implications) are reasonably well established (Fatoric and Seekamp, 2017b, Fatoric and Seekamp, 2018, Rockman et al., 2016, Sesana et al., 2021, Xiao et al., 2021). Heilen et al. (2018) proposed using model predictions of climate-change hazards to identify CRs at risk. To our knowledge, however, only Sabbioni et al., 2010, Sardella et al., 2020 have provided projections specifically designed to quantify 21st-century hazards to CRs. The former study emphasized gradual climate changes in central Europe and their impact on components of the built environment (wood, stone, metal). The latter study emphasized extreme temperature and precipitation events across central Europe with the goal being to use these projections for future risk assessments (Cacciotti et al., 2021).
Here we extend these approaches by providing heuristic examples of our strategy that identify the probability of several projected hazards occurring on nine US National Forests in the Rocky Mountains of northern Idaho and western Montana (Fig. 1). The hazards we consider are wildfire and precipitation and temperature extremes. Overlaying maps of the projected hazards on corresponding NFs allows evaluation across multiple hazards and identifies those areas on the NFs that are simulated as having the highest probability of an increase in those hazards under climate change, which we refer to as “hazard hotspots” (Cacciotti et al., 2021). CRs at highest risk can then be determined by identifying those that are present in hazard hotspots (i.e., having highest exposure) with highest vulnerability. A risk assessment allows resource managers to focus their efforts on fewer CRs than would be the case with a vulnerability assessment, thus making management plans for adaptation with existing capacity and resources more efficient.
3. Climate-change hazards
Climate-change hazards that cause severe damage or loss pose an increasing threat to CRs, where weather and climate extremes represent a major component of these hazards. One common thread underlying all hazards associated with anthropogenic climate change (e.g., sea level, temperature, precipitation, drought, snowpack, wildfire, floods) is that they will be unevenly distributed on the landscape and may change with time (Buotte et al., 2019, Littell et al., 2018, Sweet et al., 2017, Wehner et al., 2017). In contrast, the current state-of-the art in assessing impacts to CRs from other future hazards due to anthropogenic climate change, including wildfire, is to acknowledge that the hazard will likely increase (Davis, 2018b, Flanigan et al., 2018, Holtz et al., 2014, Rockman et al., 2016) and then identify specific details of how the hazard can damage CRs (Flanigan et al., 2018, Rockman et al., 2016, Ryan, 2010, Ryan et al., 2012, Sesana et al., 2021). None of these efforts, however, consider the spatial heterogeneity of the hazards.
Projections of changes in temperature and precipitation that underlie many hazards (e.g., temperature extremes, drought, wildfire, floods) have been available largely through the climate modeling efforts for the Intergovernmental Panel on Climate Change (IPCC) (Stocker et al., 2013). Significant progress has been made in downscaling and delivering these climate-model projections at the high spatial resolution needed by resource managers to quantify hazard distribution for a risk assessment (Lipschultz et al., 2020) (https://www.fs.usda.gov/managing-land/sc/data-dashboard), and such deliverables will continue to improve with increasing model resolution (Gutowski et al., 2020, Sardella et al., 2020), improvements in downscaling (Lipschultz et al., 2020, Pierce et al., 2014), and improvements in process models.
Assessments of historical changes in and projections of wildfire have largely only developed in the last two decades (Wehner et al., 2017), but their findings clearly indicate that quantifying the impacts of future wildfire to CRs is also now warranted. For example, there has been a significant increase in wildfire activity in the western United States over the last three decades, as reflected by area burned (Littell et al., 2009, Parks and Abatzoglou, 2020) and the number of large fires (Dennison et al., 2014). Attribution studies suggest that anthropogenic climate change has caused the cumulative area burned in the western U.S. to nearly double since 1984 (Abatzoglou and Williams, 2016) and to increase by a factor of 7–11 in adjacent western Canada (Kirchmeier-Young et al., 2019). Finally, projections suggest that wildfire area and possibly severity will likely continue to increase through the remainder of this century associated with increasing anthropogenic emissions of greenhouse gases, albeit with strong spatial heterogeneity (Abatzoglou et al., 2019, Buotte et al., 2019, Halofsky et al., 2020, Littell et al., 2018). Projections of increased wildfire activity and the associated impact on CRs thus also makes it a key consideration for CR management plans addressing climate change.
4. Projections of climate-change hazards: Methods
Climate projections that underlie hazard projections are based on (i) scenarios that describe plausible societal actions from now into the future, (ii) the likely greenhouse gas (GHG) emissions trajectories associated with those actions and corresponding GHG concentrations in the atmosphere, and (iii) the resulting climate changes as simulated by global climate models. Because scenarios are developed in a risk-based framework with a high degree of uncertainty about future societal developments, the primary scenarios used in policymaking contexts are usually not assigned a formal likelihood of occurrence, but instead provide a range of plausible outcomes (i.e., projections as opposed to predictions) (Terando et al., 2020).
Hazard projections used here are associated with two scenarios developed for the IPCC. The SRES A1B scenario (from IPCC AR4) describes a balance between fossil-fuel intensive technologies and non-fossil-fuel energy sources (Nakićenović and Swart, 2000). The RCP8.5 scenario (from IPCC AR5) is based on high energy demand and GHG emissions in the absence of climate change policies (Collins et al., 2013). Climate projections used for one set of wildfire projections used here (Littell et al., 2018) were run prior to AR5 and so used the SRES A1B scenario, whereas all other projections used in this study were run following AR5 when the RCP8.5 scenario was available. Projected mid-21st century global warming is similar for the two scenarios (1.5–2.0 °C) with increasing differences occurring by the end of the century (globally ∼ 3 °C for A1B and ∼ 4.5 °C for RCP8.5) (Collins et al., 2013).
We use projections of several hazards that are expected to increasingly cause damage to CRs in the interior mountainous regions of the western U.S. (Davis, 2018a, Davis, 2018b, Flanigan et al., 2018, Rockman et al., 2016). Projections of temperature and precipitation extremes are derived from climate model simulations that we statistically downscaled and bias corrected by Localized Constructed Analogs (LOCA) (Pierce et al., 2014)), while two independent projections of wildfire are from Littell et al., 2018, Buotte et al., 2019).
4.1. Temperature and precipitation extremes
The climate projections from LOCA used here are based on an ensemble of 32 global climate models (GCMs) forced by the RCP8.5 scenario and are downscaled to 1/16° × 1/16° (∼6‐km × 6‐km) (Lipschultz et al., 2020)). We then used these data to calculate the change in the median of climate extremes for the 2020–2049 (“2030s) and 2070–2099 (“2080s”) time intervals relative to the historical (1980–2009) in order to capture near-term changes and those occurring later in the century, respectively. Following Sardella et al. (2020), we calculate three climate extreme indices defined by the Climdex Project (www.climdex.org) that are directly relevant to impacts to CRs. The temperature Tx90p index is the percentage of days in a year when daily maximum temperature is greater than the 90th percentile. Such extreme temperatures adversely affect CRs through increased decay of organic and stone archaeological structures and materials (Rockman et al., 2016). Precipitation increases, especially in the extremes, can potentially cause damage to CRs through increased site erosion from surface runoff or mass movement, or through increased wood rot or masonry decay, whereas precipitation decreases, especially leading to drought, can cause damage through increased exposure of sites to erosion or also through decay of wood or masonry (Rockman et al., 2016). We used two indices of precipitation extremes. The CDD index (Consecutive Dry Days) is the maximum number of consecutive days in a year with precipitation being < 1 mm/day, and is thus an indicator of lengthening of the dry season. The R20mm index is the number of days in a year with precipitation ≥ 20 mm/day, thus reflecting an increase in heavy rain that may lead to increased erosion through surface runoff or landslides.
4.2. Wildfire
We use published projections of change in wildfire for the western U.S. for 2030–2059 (“2040s”) (Littell et al., 2018) and 2020–2049 (“2030s”) (Buotte et al., 2019) relative to the historical period (1980–2009). Although the two projections are based on different climate models and scenarios and are presented at different spatial scales, the differences between the two scenarios (A1B and RCP8.5) are negligible for the time intervals of the two projections (2030s and 2040s). Any agreement between the two independent lines of evidence thus helps establish confidence in their results.
Littell et al. (2018) (herein L18) developed a new set of ecologically based fire projections across the western U.S. at the scale of Bailey’s ecosections, which are defined primarily by vegetation within a related climate type (Bailey, 1995). The rationale for using the ecosection scale was to represent climate and wildfire at scales closer to those relevant for resource management while retaining sufficient statistical representation of fires in the historical record (Littell and Gwozdz, 2011). L18 classified climate-fire relationships for Bailey’s ecosections that represent a range of fire climatologies from fuel limited to flammability limited. Purely fuel-limited ecosections are typically drier ecosystems where fuels are dry enough to burn most years, but abnormally wet years in the year prior to fire (e.g., greater potential evapotranspiration, greater precipitation, greater snow water equivalent, etc.) can create larger or more connected fuels that then lead to larger fires.
Purely flammability limited ecosections are associated with wetter forests where it takes an abnormally warm, dry year or years (e.g., less precipitation, less snow water equivalent, etc.) to make normally wet fuels more flammable. L18 developed an F index that indicates the position of each ecosection in the historical period along the continuum from fuel to flammability limitation. This produces a continuous variable that describes the climatic controls of fire area burned from completely fuel limited (-1) to completely flammability limited (1). Ecosections in northern Idaho and western Montana have more positive F indices (>0) indicating that they are dominantly flammability limited.
The L18 wildfire projections are based on climatologies for the 2040s derived from the mean of ten global climate models forced by the A1B scenario. L18 used statistically downscaled climate model results at 1/16° × 1/16° (∼6‐km × 6‐km) for the western United States derived from Littell et al. (2011). The statistically downscaled temperature and precipitation were then used to drive a hydrologic model to derive important ecoclimatic variables such as potential evapotranspiration and snow water equivalent (Elsner et al., 2010). The future ecoclimatic variables were then used as predictors in the ecosection statistical climate-fire models to project expected area burned contingent on future climate at the scale of the ecosections.
We used historical data compiled by L18 to determine the mean of acres burned for 1980–2009 (historical) for each of the ten ecosections that occur in northern Idaho and western Montana (Fig. 1, Fig. 2). We then derived the mean of simulated area burned for each ecosection from 91 realizations of the climate projected for the 30-yr periods for the 2040s. These are the projections for the mean climate from the ten different global climate models under the A1B emissions scenario. The historical data were then used as the baseline for determining the projected relative changes in area burned during the 2040s for each ecosection. The relative changes, which we refer to as increase factors, provide a means of quantifying the probability of wildfire that contributes to the risk of wildfire to CRs. Fig. 2 shows anywhere from a two-fold to 26-fold increase in the projected mean area burned in each of the ten ecosections relative to the historical area burned.

Download : Download full-size image
Fig. 2. Box plots of historical (1980–2009) (yellow) and 2040s projected (red) area burned by ecosection in the study area (units are in log10 ha). Increase factors (shown below 2040s box plots) are ratios of 2040s/historical acres burned. (For interpretation of the references to colour in this figure legend, the reader is referred to the web version of this article.)
We next used a Geographic Information System (GIS) to determine the area of each ecosection that occurs on the nine NFs in northern Idaho and Montana (Table 1). We used USFS data to determine the historical acres burned on each NF and, assuming the area burned was equally distributed across the Forest, allocated this into each of the ecosection areas on the Forest (Table 1). We then multiplied the historical acres burned for each ecosection area on the Forest by the increase factors derived above from each of the ecosections to determine the mean estimated increase in area burned and associated increase factors on the NFs during the 2040s (Table 1).
Table 1. Summary of acres burned in ecosections covering U.S. National Forests.
| Ecosection | % of Forest | Historical acres burned | 2040s acres burned | 2040s increase factor | |
|---|---|---|---|---|---|
| Beaverhead-Deerlodge National Forest | M331A | 1% | 1922 | 20525 | 10.7 |
| M332A | 1% | 1922 | 41742 | 21.7 | |
| M332B | 19% | 36514 | 102240 | 2.8 | |
| M332E | 79% | 151823 | 522270 | 3.4 | |
| Bitterroot National Forest | M332A | 63% | 442692 | 3000000 | 21.7 |
| M332B | 37% | 259994 | 727982 | 2.8 | |
| Custer Gallatin National Forest | 331G | 16% | 219906 | 677311 | 3.1 |
| M331A | 62% | 852136 | 3000000 | 10.7 | |
| M331B | 2% | 27488 | 2474 | 0.1 | |
| M332D | 10% | 137441 | 285878 | 2.1 | |
| M332E | 5% | 68721 | 236399 | 3.4 | |
| Flathead National Forest | M332B | 9% | 53974 | 151127 | 2.8 |
| M333B | 34% | 203902 | 3000000 | 26.3 | |
| M333C | 55% | 329841 | 2414434 | 7.3 | |
| M333D | 2% | 11994 | 152686 | 12.7 | |
| Helena-Lewis and Clark National Forest | M332B | 20% | 135359 | 379005 | 2.8 |
| M332C | 9% | 60911 | 1533142 | 25.2 | |
| M332D | 59% | 399309 | 830562 | 2.1 | |
| M332E | 3% | 20304 | 69845 | 3.4 | |
| M333C | 8% | 54144 | 396331 | 7.3 | |
| Idaho Panhandle National Forests | M333A | 28% | 7925 | 26233 | 3.3 |
| M333B | 8% | 2264 | 59509 | 26.3 | |
| M333D | 64% | 18115 | 230608 | 12.7 | |
| Kootenai National Forest | M333B | 81% | 113515 | 2983166 | 26.3 |
| M333D | 19% | 26627 | 338960 | 12.7 | |
| Lolo National Forest | M332A | 3% | 11149 | 242154 | 21.7 |
| M332B | 28% | 104056 | 291357 | 2.8 | |
| M333B | 6% | 22298 | 585985 | 26.3 | |
| M333C | 1% | 3716 | 27203 | 7.3 | |
| M333D | 63% | 234127 | 2980431 | 12.7 | |
| Nez Perce-Clearwater National Forest | M332A | 59% | 449914 | 3000000 | 21.7 |
| M333D | 27% | 205893 | 2621015 | 12.7 |
Wildfire projections by Buotte et al. (2019) (herein B19) are based on simulations for the 2030′s using two GCMs forced by the RCP8.5 scenario. GCM climate data were then downscaled to run the Community Land Model (CLM) at 1/24° × 1/24° (∼4‐km × 4‐km) resolution over the western U.S., or considerably higher than the scale of ecosections. The CLM calculates multiple biophysical and biogeochemical processes, including surface heat fluxes, photosynthesis, evaporation, transpiration, and decomposition. B19 enhanced the ecological resolution of CLM by refining the definitions of CLM’s default plant functional types (PFTs) into thirteen PFTs.
The CLM fire module is a process-based global fire parameterization scheme that simulates fire occurrence and fire spread (Li et al., 2012). For fire occurrence, the number of fires is determined by ignition counts largely due to fuel load, fuel moisture, and human suppression. Buotte et al. (2019) modified the upper and lower fuel limits within grid cells to correspond to the range of forest biomass in their domain. Average burned area of a fire is then determined by average fire spread rate and fire duration. B19 found that over the western United States, their modified CLM estimates of area burned were highly correlated with observations (R2 = 0.75).
The B19 wildfire projections are based on the difference in simulated future (2020–2049) minus simulated historical (1980–2009) area burned weighted by the future area burned. The resulting distribution of weighted differences in area burned was classified into low (<10%), medium (>10%, <100%), and high (>100%). Final wildfire fire rankings that accounted for differences in climate projections were assigned uncertainty classes, with Uncertain (=1) being one GCM low and one high, Low (=2) where both GCMs are low, Med‐Low (=3) with one low and one medium, Medium (=4) with both GCMs medium, Med‐High (=5) with one medium and one high, and High (=6) where both GCMs are high.
5. Projections of climate-change hazards for US National Forests in the northern Rocky Mountains
5.1. Temperature and precipitation extremes
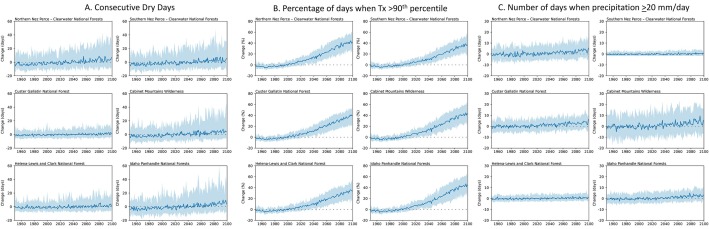
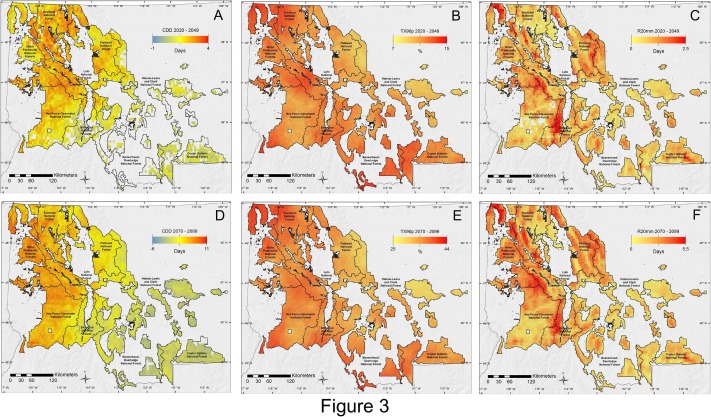
Fig. 3 shows the projected median climate extremes for the nine NFs for the 2030s and 2080s. In both cases, there are strong spatial variations in the extremes, while at any given location, the increases seen in the 2040s relative to the historical continue into the 2080s reflecting the continuation of the local trend throughout the century (Fig. 4). Areas of NFs in northern ID and northwestern MT are projected to experience the largest increases in CDD (Fig. 3A, D), whereas areas of NFs in the northern ID and southwestern MT parts of our domain will experience the largest increases in temperature extremes (Fig. 3B, E). The largest increases in precipitation extremes, on the other hand, occur primarily in association with high-elevation mountainous areas (Fig. 3C, F) reflecting an increase in orographic precipitation that characterizes the region today, with some of these increases occurring in areas of large increases in CDD or temperature extremes.
Fig. 3 shows the projected median climate extremes for the nine NFs for the 2030s and 2080s. In both cases, there are strong spatial variations in the extremes, while at any given location, the increases seen in the 2040s relative to the historical continue into the 2080s reflecting the continuation of the local trend throughout the century (Fig. 4). Areas of NFs in northern ID and northwestern MT are projected to experience the largest increases in CDD (Fig. 3A, D), whereas areas of NFs in the northern ID and southwestern MT parts of our domain will experience the largest increases in temperature extremes (Fig. 3B, E). The largest increases in precipitation extremes, on the other hand, occur primarily in association with high-elevation mountainous areas (Fig. 3C, F) reflecting an increase in orographic precipitation that characterizes the region today, with some of these increases occurring in areas of large increases in CDD or temperature extremes.
Download : Download full-size image
Fig. 3. Projected median climate extremes for the nine National Forests for the 2030s and 2080s relative to the historical (1980–2009). (A) CDD (Consecutive Dry Days) index for 2030s. (B) Tx90p index (percentage of days in a year when daily maximum temperature is greater than the 90th percentile) for 2030s. (C) R20mm index (number of days in a year with precipitation ≥ 20 mm/day) for 2030s. (D) CDD index for 2080s. (E) Tx90p index for 2080s. (F) R20mm index for 2080s. We only show median values where > 60% of the 32 models in the ensemble agree on the sign of change.

Download : Download full-size image
Fig. 4. (A) Time series of the CDD (Consecutive Dry Days) index for 1950–2100 relative to the historical (1980–2009) for six different grid locations on National Forests within the Northern Region. (B) Time series of the Tx90p index (percentage of days in a year when daily maximum temperature is greater than the 90th percentile) for six different grid locations on National Forests within the Northern Region. (C) Time series of the R20mm index (number of days in a year with precipitation ≥ 20 mm/day) for six different grid locations on National Forests within the Northern Region. Custer Gallatin National Forest: 45.2218505557156, −109.92090831954312. Helena-Lewis and Clark National Forest: 46.90238553920221, −110.77268944816251. Northern Nez Perce-Clearwater National Forest: 46.817210415033195, −115.06179047298947. Southern Nez Perce-Clearwater National Forest: 45.759327993592244, −115.33549090662291. Cabinet Mountains Wilderness: 48.20894763512027, −115.69873239031664. Idaho Panhandle National Forest: 47.87846233086076, −116.3145633989287.
5.2. Wildfire
Increase factors for the 2040s derived from the L18 projections (Fig. 2) and the B19 wildfire projections for the 2030s identify the spatial distribution of wildfire probability on each NF in the next few decades relative to the historical (Fig. 5). Despite the differences in resolution, both projections agree in showing large increases in wildfire on the Custer-Gallatin NF, the southern part of the Nez Perce-Clearwater NF, the northern Kootenai NF, and the northern Helena-Lewis and Clark NF, increasing confidence in the projections for these areas. Both projections also show that the probability of wildfire increase will be spatially variable. Specifically, increase factors from the L18 projections for five of the ecosections are 2, 3, 3, 3, and 7, whereas increase factors for the other five ecosections are considerably higher at 11, 13, 22, 25, and 26. Similarly, the B19 projections are largely either Low or High.
At the same time, however, there are clear differences between the two projections. First, the higher resolution CLM model used by Buotte et al. (2019) finds greater spatial variability across each NF than identified at the ecosection scale. These differences are expected as they largely reflect the assumption that the 2040s increase factors determined for each ecosection are stationary linear responses to climate and can be applied across the ecosection equally. Second, the L18 projections for the NFs in west-central Montana (Bitterroot, Beaverhead-Deer Lodge, Lolo, and southern Helena-Lewis and Clark) suggest much lower probabilities of wildfire than the B19 projections (Fig. 5). Such inter-model disagreement decreases confidence in the projections for these areas, which would be factored into the assessment of hazard probability. We note, however, that compared to climate modeling, modeling of projected wildfire change is still in its early stages, with L18 and B19 being the most recent examples of only a few such modeling efforts conducted thus far for the western U.S. Further work is needed to understand the differences identified in Fig. 5 and new projections would be included during the iterative risk management process.
6. Discussion
6.1. Implications for management
We developed and applied a framework for assessing climate vulnerability to CRs, and CR managers can follow the approach outlined here to prioritize known sites for evaluation according to their association with hazard hotspots (i.e., exposure). Given that risk is represented as the probability of occurrence of hazards multiplied by the impacts if those hazards occur (Oppenheimer et al., 2014), CRs at highest risk will only occur in hazard hotspots. Prioritizing hazard hotspots for establishing CR exposure thus increases efficiency relative to measures that are based on still widely used vulnerability assessments which do not evaluate hazard probability (Halofsky et al., 2018a, Halofsky et al., 2018b, McNeeley et al., 2017, Rockman et al., 2016). As an example of this, we use the L18 projections of increase area burned to show that, even at the scale of ecosections, accounting for the spatial variability in burned area across the landscape translates to efficiency in assessing CR risk to wildfire. Specifically, the cumulative area represented by the highest increase factors on each NF in our study region is 35% of the total area (Fig. 5A). Given that a risk assessment will prioritize CRs in these hazard hotspots, this represents a 65% reduction in area where efforts to evaluate CR exposure and vulnerability need to be emphasized. The B19 projections demonstrate how increasing the spatial resolution of the projections can further increase efficiency in assessing CR risk to wildfire. Specifically, the cumulative area represented by the High projections on the NFs is 17% of the total area (Fig. 5B), representing a 83% reduction in area where initial efforts to manage for climate change impacts to CRs need to be concentrated.
Given that climate change may result in an increase in multiple hazards in any given region, with each having their own spatial pattern of hazard hotspots (Fig. 3, Fig. 6), CR managers may face scenarios where differing areas of their land base will have differing hazard hotspots, thus requiring climate risk management plans specific to each land base to address any differences in impacts posed by the hazards to the CRs. At the same time, some areas may have overlapping hazard hotspots which would compound the hazard impact as well as present challenges if adaptation measures to reduce risk from each hazard conflict. Knowing which hazards are likely to occur, however, means that CR managers will only need to assess risk from them rather than address the full range of possible hazards that would be required in a vulnerability assessment.
Download : Download full-size image
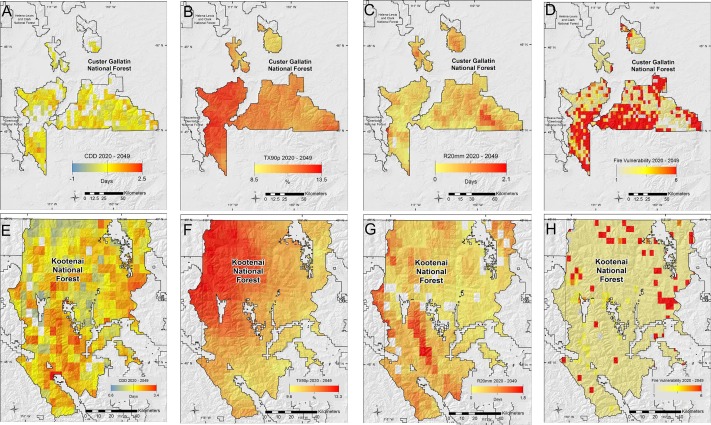
Fig. 6. Distribution of hazards projected for the 2030s for the Custer-Gallatin and Kootenai National Forests. We only show median values for climate indices where > 60% of the 32 models in the ensemble agree on the sign of change. (A) CDD index for the Custer-Gallatin National Forest. (B) Tx90p index for the Custer-Gallatin National Forest. (C) R20mm index for the Custer-Gallatin National Forest. (D) Wildfire projections for the Custer-Gallatin National Forest for the 2030s (Buotte et al., 2019). (E) CDD index for the Kootenai National Forest. (F) Tx90p index for the Kootenai National Forest. (G) R20mm index for the Kootenai National Forest. (H) Wildfire projections for the Kootenai National Forest for the 2030s (Buotte et al., 2019).
Fig. 6 illustrates these points by comparing the distribution of the four hazards projected for the 2030s that are considered here for the Custer-Gallatin and Kootenai NFs. CR managers on the Custer-Gallatin NF would primarily address impacts from widespread wildfire with areas of lengthening of the dry season (CDD) in the western part of the NF, whereas CR managers on the Kootenai NF would primarily address impacts from widespread CDD with areas of extreme temperatures in the northwestern quadrant of the NF and areas of potential erosion in the southwestern quadrant.
The next step in our framework involves establishing the level of exposure of a CR to the hazard. CRs with highest exposure will occur in hazard hotspots, thus allowing CR managers to identify which CRs to prioritize for evaluating vulnerability, resulting in a further increase in efficiency. For example, consider two NFs where the distribution of hazard hotspots and the number of CRs is the same. On the first NF, however, 90% of the CRs are in hazard hotspots, whereas on the second NF, only 10% of the CRs are in hazard hotspots, resulting in 88% fewer highly exposed CRs that would be prioritized for evaluation of vulnerability than on the first NF. This has important implications for managing risk on different administrative land units. Because U.S. federal laws require that the location of CRs on U.S. federal lands not be publicly disclosed, Fig. 7 illustrates this point by comparing the B19 wildfire projections with the distribution of hypothetical CRs on the Kootenai and Custer-Gallatin NFs whose locations were randomly generated.
In our hypothetical example, both NFs have similar numbers of CRs (232 on the Kootenai NF, 186 on the Custer-Gallatin NF), whereas wildfire projections for these two NFs show a significantly larger area of high-probability wildfire occurring on the Custer-Gallatin NF than on the Kootenai NF. In these examples, only 2% (n = 4) of the CRs on the Kootenai NF are highly exposed, while 32% (n = 60) of the CRs on the Custer-Gallatin NF are highly exposed, thus identifying different capacity and budget needs for each NF’s climate risk management plan.
This strategy can also be applied to CRs that have yet to be identified by using predictive models (Heilen et al., 2018) and inventory plans that NF CR managers commonly develop to assist in their cultural resource survey work. These models are based on the relationship between known CR sites and characteristics of the landscape in which they occur. The most significant predictor of CR location is typically slope angle, with a clear majority of CRs commonly occurring on 10-15° slopes. In developing CR climate risk management plans where no inventory has yet been completed, CR managers can thus query NF-specific predictive models and if, for example, the strongest predictor is slope, use a GIS to overlay digital elevation models on hazard maps to predict areas with the highest concentration of CRs with highest exposure.
6.2. Projection uncertainties
Adaptation and risk management policies and practices should recognize and explicitly include uncertainties that underlie a risk assessment (Lavell et al., 2012, Terando et al., 2020). Climate-change projections that are the basis for calculating hazards are associated with at least three sources of uncertainty. The first is related to how closely the greenhouse gas emission scenarios that underlie the projections (A1B and RCP8.5) will track actual emissions that occur this century. Schwalm et al. (2020) noted that the RCP8.5 emission scenario, which is the basis for most of our projections, is consistent with historical cumulative carbon emissions, remains consistent with emissions projected for the mid-21st century under current policies, and may still be plausible by the end of this century. Moreover, differences between the A1B and RCP8.5 scenarios used for the mid-21st century projections in this region are comparatively small for all but the latest 21st century. In any event, this source of uncertainty can be readily addressed as part of the iterative risk management process by monitoring emissions and, if necessary, implement new projections based on better constrained emission scenarios at a later time.
The second major source of uncertainty in climate-change projections for a given future scenario is associated with differences among climate models that reflect the complexity and large number of processes they include and the different ways in which these processes are represented (Collins et al., 2013). For the climate-extreme hazards reported here, we addressed this uncertainty by only showing median values where > 60% of the 32 models in the ensemble agree on the sign of change (Fig. 3). We also assessed whether the spatial patterns of the median hazard distributions are stationary within the minimum to maximum ranges of these results. For all three indices, these patterns are replicated, although their geographic extent and intensities decrease for the minimum ranges and increase for the maximum ranges (Fig. 4). This replication gives confidence in the spatial pattern, while the maximum values could be used to address risk tolerance.
A third major source of uncertainty is interannual-to-decadal climatic variability that affects the northern Rocky Mountain region but is often more temporally persistent than many GCM simulations and can be muted by ensemble mean approaches to future climate projections. Using multi-decadal climatologies and a range of scenarios generally limits the potential cascading uncertainty associated with this variability (Terando et al., 2020), but the risk analysis could recognize the potential for observations to either exceed or subceed model (especially ensemble) projections for a year or years at a stretch for a given region.
Another source of uncertainty in using model projections are the downscaling methods (modified delta similar to BCSD for L18, LOCA for extremes). The climate metrics extremes calculated here are dependent on the downscaling and bias correction methods that modify the simulated variable distributions, which is especially relevant for the thresholds used in R20mm and CDD.
Of the hazards assessed here, wildfires will likely have the largest impact on CRs given that they will be widespread, often severe, and pose an immediate threat when they occur as opposed to the more gradual timelines associated with damages from temperature or precipitation changes. Evaluating uncertainties in wildfire projections is thus particularly important in assessing their impacts. Uncertainties include those associated with the underlying climate projections described above as well as those associated with the models used to derive wildfire occurrence from model climatologies.
Uncertainties in the L18 projections include the assumption that the 2040s increase factors determined for each ecosection are stationary linear responses to climate and can be applied across the ecosection equally. Not all vegetation or fuels within a given ecosection were equally available historically, however, nor do we expect them to change at the same rate in the future. Furthermore, it is likely that those fuels that contributed most to the historical fires will be most and first available during the early part of the 21st century under climates most resembling the historical, whereas during the latter part of the century, vegetation and fuel types and their availability might be quite different.
The last two fire years in California illustrate two things worth noting in this regard. First, some of the projected changes in mean annual area burned appear very large, but regionally, extreme years much larger than the historical mean can occur and are surprising with only the historical regime as a reference. Whether such events become as common as implied by the projection means depends on climate, fuels, and ignition (including changes in human ignitions). Second, under extreme conditions (relative to historical), fire areas indicated by the future analysis could occur earlier than the time frame projected.
Applying statistical fire area projections in these landscapes is also limited by modeling assumptions. Among them are that: (1) we assume regional climate was and is the main driver of fire area burned – other drivers, such as vegetation and management, were not explicitly modeled; (2) the changes in future area burned will be linear extensions of observed changes – some fire regimes may approximate that assumption, but others may not; and (3) the ecosection-scale changes in fire responses will be equally distributed across the ecosections and that the differences among them transition at ecosection boundaries. As a result, in the example shown here, there is some chance that our climate-fire modeling assumptions may result in some places with fewer impacts than predicted and other places with more impacts than predicted.
The B19 wildfire projections also include several assumptions that introduce uncertainty, leading Buotte et al. (2019) to conclude that areas identified as having highest probability of an increase in area burned does not necessarily mean that they will burn or burn with high intensity if ignited. First, simulated fire ignition is estimated from observations of historical lightning strikes, with no reference as to how the frequency of lightning strikes may change in the future. Similarly, forest distributions are based on existing PFTs and do not change through the period of the projection. Finally, as with the L18 projections, the CLM fire module does not account for human-caused fire, fire suppression policies, or suburban and rural population sprawl, all of which may have a large effect on area burned. We also note that neither of the two wildfire projections used here estimate fire severity, which may be particularly important in evaluating CR vulnerability.
One solution to these shortcomings in existing wildfire projections is to begin doing finer scale, process-based fire modeling, informed by the highest priority CRs, which would also allow modeled trials of adaptation options (thinning, prescribed burning, etc.) that might change the estimated risk and increase the odds CRs would be as little affected as possible.
7. Conclusions
We have outlined a strategy to assess risk of CRs to anthropogenic climate change that involves establishing climate-related hazards from projections of climate change in response to increased greenhouse emissions during the 21st century, thus providing a science-based framework for proactive decision making in the context of climate change. In particular, we have used new and existing projections of hazards to illustrate heuristically how a CR manager can implement them in the first steps of a risk assessment to identify the probability of hazard occurrence and exposure of CRs to that hazard. Significant progress has been made in delivering climate-model data at the high spatial resolution needed by resource managers to quantify hazard distribution for a risk assessment (Lipschultz et al., 2020) (https://www.fs.usda.gov/managing-land/sc/data-dashboard), and such deliverables will continue to improve with increasing model resolution (Gutowski et al., 2020), improvements in downscaling (Lipschultz et al., 2020, Pierce et al., 2014), and application of process models of hazards (Van Dusen et al., 2020).
Framing these proactive measures in the context of a risk assessment will provide a more effective means for decision makers to manage CRs for climate-change impacts through adaptation. The fact that hazards from climate change will be spatially heterogeneous as opposed to uniformly distributed makes a risk assessment particularly useful for prioritizing CRs for adaptation and management. Such efforts build on current vulnerability assessments which do not account for the probability of hazard occurrence.
Once the CRs with highest exposure are identified, the level of risk of CRs can be established according to their vulnerability characteristics, which are reasonably well established (Rockman et al., 2016, Sabbioni et al., 2010, Sesana et al., 2021). Depending on capacity, prioritizing these CRs for adaptation and management, however, may still require that the significance of the CR be considered in accordance with the National Historic Preservation Act and its implementing regulations. At the same time, additional insights should be sought through engagement and consultation with diverse stakeholders, including Indigenous communities, where such “multi-level decision-making can enhance a better understanding of the different values, priorities, and risk perceptions” (Fatoric and Seekamp, 2017c). Such engagement guides decision making in the implementation of adaptation measures that reduce risk by reducing exposure and vulnerability. Additional factors that affect prioritization include availability of budgetary, technical, and institutional resources needed for adaptation (Heilen et al., 2018, Xiao et al., 2021). The effectiveness of adaptation, however, is limited by uncertainties in the severity and timing of climate-change impacts. Responding to climate-related risks thus requires iterative risk management that involves an ongoing process of assessment, action, monitoring, and reassessment as new information becomes available that will continue to inform adaptation measures over the long timeframes associated with future anthropogenic climate change (Jones et al., 2014).
Declaration of Competing Interest
The authors declare that they have no known competing financial interests or personal relationships that could have appeared to influence the work reported in this paper.
Acknowledgments
We thank Polly Buotte for generously sharing her wildfire projections, John Bradford and Carl Davis for their insightful comments on an earlier draft, and the four reviewers for their suggestions that helped improve the paper. This research did not receive any specific grant from funding agencies in the public, commercial, or not-for-profit sectors. Any use of trade, firm, or product names is for descriptive purposes only and does not imply endorsement by the U.S. Government.
References are available at the original paper.