By Andy May
The Creative Society ask to interview me on the 20th century climate shifts that Dr. Javier Vinós and I discussed in Part IV of our series of posts on Javier’s Winter Gatekeeper hypothesis. I don’t agree with a lot of the Creative Society ideas, but we do agree that open discussion on the future of mankind is important. I was pleased that an organization that has such a different outlook on civilization would want to interview me, a proponent of small and local government. More discussion and debate between differing worldviews is needed today. The interview was October 10th, but it has not been posted or published yet.
Most of this talk is based on Chapter 11 of Javier Vinós’ new book: Climate of the Past, Present, and Future: A Scientific Debate. This is a graduate school level review of natural climate change processes, an often-ignored area in modern discussions of climate science. The book comprehensively introduces Javier’s new Winter Gatekeeper hypothesis of natural climate change.

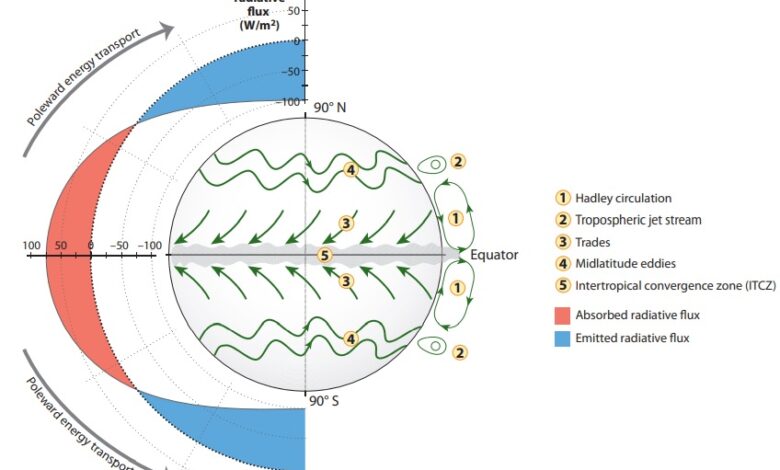
Earth’s global average surface temperature changes constantly, at all timescales. Earth is never in thermal equilibrium, and powerful natural forces are always at work redistributing the absorbed radiation from the sun, some of the major processes are illustrated in Figure 1. The sun delivers more radiation to the tropics than to the higher latitudes because it is more directly overhead. In fact, it delivers so much to the tropics it cannot all be radiated to space, the excess is shown in red. In addition, Earth’s tropical ocean surface temperature is capped at about thirty degrees Celsius, since at that temperature the energy lost to evaporation and deep convection always equals the excess energy delivered.
Because the tropical sea-surface temperatures are capped, global warming is mostly a function of polar temperature. Thus, the key to climate change, at all timescales, is the meridional, or north-south, transport of energy from the tropics to the poles.
When meridional energy transport is stronger, more energy reaches the poles. Most moisture transported to the poles in winter freezes, emitting its latent heat, and warming the surrounding air. Additional CO2 molecules in the polar air increase outward radiation since they are warmer than the surface. The net result is that nearly all imported energy into the polar regions in winter eventually exits the climate system at the top of the atmosphere, as shown in blue in Figure 1. Increasing the energy transported there mostly just increases the energy lost. The result is a cooling planet.
As more energy is directed toward the poles, sometimes the Arctic region warms, even as the rest of the world cools or warms more slowly. The Arctic warmed, for example, as the rest of the world cooled, from 1880 to 1910, 1965 to 1976, and from 2005-2015. When meridional transport is weaker, less energy reaches the poles and exits the climate system, and the planet warms, as the Arctic cools, because it is receiving less energy from the lower latitudes.

Commonly natural climate change is viewed as cyclical, but since 1951 nature is thought to have a near zero net climate effect by “consensus” climate scientists, as represented by the Intergovernmental Panel on Climate Change, or the IPCC, as shown in Figure 1 here, from AR5, page 6. Also, we commonly hear that as the global average temperature goes up, storminess, or so-called extreme weather increases. Here we present some often-ignored data that shows both ideas are incorrect oversimplifications.
As you can see in the lower right of Figure 2, Earth is a rotating sphere, and the axis of rotation is tilted relative to its orbit around the sun. The orbit is slightly eccentric such that Earth receives more sunlight in January, than in July. As a result, Earth’s global average surface temperature varies almost four degrees every year. It is near 16°C in July and a little over 12°C in January. Why panic over an increase of two degrees Celsius? We see twice that every year.
The poles are dark in winter, they simply receive energy from the tropics and radiate it to space. The more energy they receive from the tropics in winter, the more they radiate, cooling the rest of the planet. If they receive more energy in the summer, it goes into melting ice. When the summer meltwater re-freezes in winter it releases the stored summer energy (called “latent heat”) and radiate that to space as well. This is how variations in the amount of heat delivered via meridional transport cause climate change. The evidence and processes involved in meridional transport will be briefly covered in this talk as well as the evidence that periodic shifts in Earth’s climate state occur about every 25 years. Climate shifts change the relationship between delivered solar energy and climate through changes in meridional transport.
The Winter Gatekeeper hypothesis proposes that changes in the meridional transport of energy and moisture are the main way the climate changes now and in the past. Meridional transport variability integrates the many forces that act on it simultaneously and in different timeframes. Thus, interpreting exactly how and why meridional transport affects climate is difficult. We can see it happening, and will show the data, but we cannot always explain why. The forces that act on it and through it are multidecadal ocean-atmosphere oscillations, solar variability, ozone, stratospheric-reaching tropical volcanic eruptions, orbital changes, and changing lunar and solar gravitational pull. Meridional transport is an integrator of internal and external forces. It is not the only way climate changes, but evidence suggests it is the main actor.
The Winter Gatekeeper hypothesis does not disprove greenhouse gas effect induced climate change—manmade or otherwise—in fact, it primarily acts through the greenhouse gas effect. But it does not require changes in non-condensing greenhouse gases (like CO2) to cause significant climate change. Therefore, it does refute the hypothesis that CO2 is the main climate change control knob.
Meridional transport moves energy that is already in the climate system (mainly from the tropics) toward its exit point at the top of the atmosphere at a higher latitude. It is carried out mainly by the atmosphere—in both the stratosphere and troposphere—with an important oceanic contribution. The greenhouse effect is not homogeneous over the planet due to the unequal distribution of water vapor, the most powerful greenhouse gas. Water vapor provides about 75% of the total global greenhouse effect according to Lacis, et al., Raymond Pierrehumbert gives a value of 67%, and Wijngaarden and Happer, 61%, either way water vapor is the most important greenhouse gas. The total greenhouse effect is stronger in the wet tropics, weaker over deserts, and much weaker at the poles in winter, as Figure 2 makes clear.
Roughly every 25 years, the climate shifts from one state to another, these shifts involve changes in meridional transport. We can see one aspect of the most recent shift, that occurred between 1997 and 2005, in the upper right portion of Figure 2. Prior to this shift, summer outgoing radiation exceeded winter outgoing radiation and the planet warmed rapidly. After 2005, the winter sent out more radiation than the summer, winter meridional transport increased, and most of the planet warmed less quickly, as you can see in the left illustration in Figure 2. Meridional transport drives climate change, but it has many forces that drive it. Besides the differential greenhouse effect driver already discussed, ocean oscillations, especially the Atlantic Multidecadal Oscillation shown on the bottom of the left illustration, are important. The top part of the left illustration shows the level of solar activity, another driver. The middle graph shows the smoothed global average temperature anomaly from the Hadley Climate Research Center in the UK. When both the Atlantic Multidecadal Oscillation and solar activity increased from 1910 to 1940, the world warmed rapidly, and meridional transport weakened.
From 1945 to 1976, the world cooled as the Atlantic Multidecadal Oscillation went into its cool phase, the Arctic also cooled, and meridional transport was weak. After 1976, transport weakened further, there was strong warming, solar activity was still elevated but declining, and the Atlantic Multidecadal Oscillation went into a strong warming phase. The world warmed rapidly.
After 1997, there was another shift, global warming slowed, the sun weakened rapidly, and the Atlantic Multidecadal Oscillation plateaued. Comparing the ascending Atlantic Multidecadal Oscillation periods from 1920 to 1940 and 1976 to 2005, one gets two impressions. The first is that the ocean cycles have a larger influence than insolation changes, and the second is that the ocean cycles have a stronger influence than CO2 emissions, since the two warming periods are similar even though the CO2 emissions were much higher during the second period.

One critical influence on meridional transport, and climate shifts, is the strength of the polar vortex. These two figures show a strong polar vortex as it existed in January of 2005. The left illustration shows the strong westerly (west to east) average wind speed surrounding the North Pole in red. This definitive, nearly circular, high westerly stratospheric wind pattern at 20 hectopascals altitude (about 23 km), is a sign of a strong polar vortex. The right-hand illustration has the altitude of 20 hectopascals marked and shows wind speed as a function of altitude and latitude. The strong vortex extends down to 100 hectopascals altitude (11 km). Under extreme conditions it can nearly reach the surface.
A polar vortex forms in winter because cooling air over an icy surface, when the area is losing energy (or heat) to space, causes an increase in air density. This increases the air pressure at the surface, forming the vortex. When the vortex is strong, it traps cold air at the pole, preventing cold air incursions into the mid-latitudes and decreasing meridional transport. When it is weak, it loses its shape and can even split in two. A weak vortex allows warm air and moisture to flow into the polar area, increasing meridional transport and emissions to space.
The polar vortex is strongest in the winter, when the Atlantic Multidecadal Oscillation is rising, and the number of sunspots is high, indicating strong solar activity. The polar vortex is weak when solar activity is low (fewer sunspots), the AMO is decreasing, and meridional transport is strong.

In the Arctic, the polar vortex strength determines the polar stratosphere-to-troposphere winter coupling. The cumulative winter Arctic Oscillation is plotted in gray in graph (a) of Figure 4 and labeled “AO.” It can be used as a proxy for polar vortex strength. When increasing, it suggests little exchange between the mid-latitudes and the pole, and a strong vortex. A strong polar vortex requires cooperation between the Arctic, Atlantic, and Pacific high latitudes and minimal air exchange with the middle latitudes.
The black line in (a) is the degree of correlation between the Aleutian Islands in the North Pacific and the Icelandic weather in the North Atlantic, it is often called the Aleutian-Icelandic low seesaw. When there is a cooperation between the Aleutian Low and the Icelandic Low, the polar vortex is strong. The periods when the vortex is strong are shaded in gray.
In Figure 4 the 20th century climate shifts, first identified in the Pacific, are shown as black dots. Here we discuss some of the major climatic features that change with each of the recent major shifts. In panel (b), the black line is a 4.5-year average Atlantic Multidecadal Oscillation index, labeled “AMO.” The data are from NOAA. The grey line is the cumulative 1870–2020 detrended (meaning the linear trend is removed) cold season North Atlantic Oscillation index, labeled “NAO.” The North Atlantic Oscillation is the difference between the pressure over Iceland and the Azores, a measure of the strength of North Atlantic westerly winds and the location of the North Atlantic winter storm tracks.
Panel (c) is the cumulative Pacific Decadal Oscillation. It is labeled “PDO.” The black dots, our climate shifts, mark the years when Pacific Decadal Oscillation regime shifts took place.
The black line in panel (d) shows the zonal (west-east) atmospheric circulation index, cumulative anomaly. The grey line in panel (d) is the 1900–2020 change in the length of day, used here as an indication of Earth’s speed of rotation. It is plotted in milliseconds and correlates well with zonal wind speed, as it should. Changes in average west-east wind speed can cause Earth’s rotation speed to vary by several milliseconds.
Panel (e) is the detrended 1895–2015 annual global surface average temperature. It is 10-year smoothed. The data are from the UK Met Office.
The panel (f) dashed line is the smoothed monthly total sunspot number. The grey line is the smoothed monthly Atlantic Multidecadal Oscillation index. The black line is the inverted 20-year running correlation of the two. Notice the correlation reverses at every climate shift, this reversal confounded solar-climate researchers for over 200 years.
The Atlantic Multidecadal Oscillation, in panels b and f, measures sea-surface temperature anomalies that reflect the strength of meridional transport over the North Atlantic. Positive AMO values indicate warm water accumulation due to reduced meridional transport and a strong polar vortex. The North Atlantic Oscillation (panel b) is the sea-level pressure gradient over the North Atlantic, and part of the Arctic Oscillation (panel a). Not surprisingly, its detrended and cumulative value is very similar to that of the Arctic Oscillation, but also shows some correlation to the Atlantic Multidecadal Oscillation sea-surface temperature anomalies.
The decades-long North Atlantic Oscillation index trends cannot be explained by general climate models as they do not incorporate multidecadal meridional transport regimes. Models consider North Atlantic Oscillation indices white noise. Without properly representing meridional transport, the IPCC climate models cannot explain climate change.
Over the Pacific sector, the Pacific Decadal Oscillation also measures sea-surface temperature anomalies. A positive Pacific Decadal Oscillation indicates warm water accumulation over the equatorial and eastern side of the Pacific, an indication of reduced meridional transport. The Pacific Decadal Oscillation values in panel (c) roughly coincide with those of the Atlantic in panel (b). Climatic shifts in the Pacific coincide with times when the Pacific Decadal Oscillation changes from predominantly positive to negative or back.
Meridional wind circulation is how most excess energy is transported out of the tropics. Increases in meridional transport imply increases in meridional circulation and corresponding decreases in zonal circulation.
A stronger polar vortex and weaker meridional transport coincide with stronger west-east (zonal) winds. A weaker polar vortex and higher meridional transport coincide with stronger north-south (meridional) winds. These periodic changes in atmospheric circulation patterns affect Earth’s rotation speed and the length of day. Earth must preserve its angular momentum, so when global atmospheric circulation becomes persistently more zonal the Earth rotates faster reducing the length of the day. The normal mid- to high-latitude zonal winds are west to east, which is the way the world turns.
Each of the four climate shifts, originally identified in the Pacific during the 20th century, took place 1–3 years after a solar minimum. The grey and white areas in Figure 4 represent alternating meridional transport regimes, each span three solar cycles, minimum to minimum. Many critical climate processes are stronger at solar minima. Based on this pattern we expect the next climate shift to take place around 2031–34. Using a frequency analysis by Nicola Scafetta, Javier Vinós has convincingly proposed that the climate shift timing is related to the 9.1-year lunar tidal cycle and the 11-year solar cycle such that they change from correlated to anti-correlated (i.e., from constructive to destructive interference) with a periodicity that not only matches the Atlantic Multidecadal Oscillation, but is exactly synchronized to it.
The significance of the ocean oscillations in Figure 4 was not discovered until 1994, by Schlesinger and Ramankutty. This was long after the “consensus” that CO2 emissions controlled the climate was formed, illustrating the danger of forming a consensus opinion before all the facts are in.

Multidecadal changes in meridional transport cause a multidecadal oscillation known as the “stadium-wave,” shown in Figure 5. It shows that internal multidecadal climate variability and global average surface temperature display a roughly 55–70-year oscillation when detrended. Interdecadal oscillations in sea-surface temperature and sea-level air pressure have been described in most oceans, including the Arctic. These oscillations affect a variety of climatic phenomena including salinity, sea-ice extent, wind speed, sea-level, and atmospheric circulation, besides sea-surface temperature and air pressure.
Marcia Wyatt integrated these processes in her thesis. She identified a multidecadal climate signal that propagated across the Northern Hemisphere through a synchronized network of fifteen climate indices, as shown. Four clusters of indices are highlighted, 1 through 4, each can be positive (warming) or negative (cooling). Peak values of group indices represent stages of climate-regime evolution. I’ve added our four 20th century climate shifts with vertical black lines. The climate shifts occur near major changes in the 15 indices.
Most energy is transported through the lower troposphere and ocean track. As a result, changes in multidecadal ocean oscillations have a greater effect on climate in the multidecadal timeframe than changes in solar activity, which mostly affect stratospheric energy transport.
Meridional transport was further reduced during the 20th century by the coincidence of the Modern Solar Maximum, the longest solar maximum in over 600 years. Besides the stratosphere, solar activity also influences the strength of the polar vortex and the El Niño/Southern Oscillation, so it has some influence on tropospheric transport.

While Marcia Wyatt could not identify the nature of the signal, or the cause of its 64-year period, she identified the Eurasian Arctic sea-ice region as the place where the signal originated. Javier Vinós and I have identified this area as the main gateway for atmospheric winter meridional transport into the Arctic. The area is very sensitive to sea-ice.
North of about 30° latitude most heat transport is through the atmosphere, mostly in storms. The two principal pathways for atmospheric heat transport to the North Pole are shown on the left-hand map in Figure 6. The graph on the right shows the trend in storminess since 1870 in the North Atlantic storm track. The red line are observations, the black line is the same dataset, but with errors corrected. The “CAI” blue curve is the seasonal cyclone activity index.
Overall, storminess has decreased since 1870, which is logical since the planet has warmed over that period. Warming takes place mostly at the poles, equatorial temperatures do not change much, which reduces the latitudinal temperature gradient, and lowers the meridional transport of energy from the tropics to poles, thus decreasing storminess.
Summary
In summary, major climate shifts occur about every 25 years. Every shift occurs at a solar cycle minimum, takes a few years to complete, and involves a reversal of the current Atlantic Multidecadal Oscillation/Solar correlation. Overall storminess or extreme weather has been decreasing since the end of the Little Ice Age in the 19th century.
There are other major shifts in the solar/climate correlation that occur roughly every 80 to 120 years. These were identified by Hoyt and Schatten, who show they occurred about 1600, 1720, 1800, and 1920. At these critical times, the global correlation between solar activity and temperature and precipitation reverses. It is unclear why it happens, but it does, and it is very confusing. This post is not about these shifts, here we cover the 25-year shifts, which mostly involve the Northern Hemisphere, especially sea-surface temperature, and sea-level air pressure. The 25-year shifts are more of a change in climate state and direction, rather than a full reversal of the solar/climate relationship. Both sets of climate shifts show that solar changes do not affect Earth’s climate directly through changes in irradiation. The solar changes change atmospheric processes, which then change meridional energy transport, which is what changes the climate.
Meridional energy transport from the tropics to the poles, and variations in it, are the principal drivers of climate change. Manmade CO2 and other greenhouse gases have a smaller role. The largest influences on meridional transport are changes in ocean oscillations (the “stadium wave”), changes in solar activity, ozone, large volcanic eruptions, orbital changes, and changes in lunar and solar gravitational pull. The relative strength of these forces on meridional transport varies with the timeframe considered. Longer term the solar influence is more important, and on the decadal timeframe, ocean oscillations are more important.
The Winter Gatekeeper hypothesis explains far more of known climate history than the manmade greenhouse gas emissions hypothesis. Neither is proven nor disproven, but the data we have today supports the Winter Gatekeeper hypothesis.
Download the bibliography here.