
by: Geoffrey H Sherrington
Scientist.
Melbourne Australia.
20th April 2022.
The short story: Can we detect a change of CO2 in the air after emission reductions following Covid-19 lockdowns?
No, we cannot, because the present measurement of CO2 in the air has errors and uncertainties that are too large to allow detection of the estimated change.
These measurement deficiencies likely arise partly from cherry picking of raw data, a problem that is widespread in climate research, making much of it eminently contestable.
……………………………………
This adds to the WUWT article of a year ago, about the Covid-19 lockdowns, their effects on estimated emissions of CO2 and whether any change is detected in the CO2 measurements at Mauna Loa, Hawaii (MLO).
The Global CO2 lockdown problem – Watts Up With That?
…………………………………………….
THE UNCERTAINTY OF CO2 ANALYSIS.
Uncertainty means different things to people in climate research. It should not, because it is defined at length in publications such as those from the international Bureau of Weights and Measures, BIPM, Paris.
At one extreme, one can use a modern analytical chemistry instrument designed for CO2 analysis, hit the start button 100 times, take a standard deviation and announce a high precision, sometimes confused with high accuracy. This approach tends to reflect little more the voltage stability of the instrument and does not help to understand climate.
At the other extreme, one can measure the CO2 over a wide range of operating conditions in the raw environment, trying to hold extraneous variables constant, to measure an operational accuracy to put into the larger uncertainty context. Some examples follow.
Many CO2 laboratories now use an IR laser cavity-ring-down spectroscopy device. One maker, Picarro, summarises instrumental performance.
We determined the measurement precision by repeated measurements of gas flowing from the 380-ppm CO2 cylinder at room temperature. A spectral scan was taken every 5 min. The standard deviation is 0.093 ppm CO2. Over an ambient temperature range of 35°C to 20°C, the measured standard deviation degraded to 0.14‑ppm CO2 ….
A year ago, New Zealand’s NIWA emailed me about their CO2 measurements at Baring Head.
“The CO2 mole fractions for the eight long-term transfer standard calibration gases are determined by the WMO Central Calibration Laboratory (CCL), with an estimated uncertainty of ±0.07 ppm (1-sigma) with respect to the WMO scale”.
(It is usually found that the instrument performance figure will be smaller than the laboratory operational figure).
Two groups measure CO2 at Mauna Loa, the USA government’s National Oceanic and Atmospheric Administration (here NOAA) and the Scripps Institute of Oceanography (here Scripps). The NOAA group continues to claim this:
Global Monitoring Laboratory – Carbon Cycle Greenhouse Gases (noaa.gov)
- The Observatory near the summit of Mauna Loa, at an altitude of 3400 m, is well situated to measure air masses that are representative of very large areas.
- All of the measurements are rigorously and very frequently calibrated.
- Ongoing comparisons of independent measurements at the same site allow an estimate of the accuracy, which is generally better than 0.2 ppm.
(my bold; NOAA Updated December, 2016; March 2018, September 2020, accessed 13th April 2022.)
Both NOAA and Scripps have posted public data for daily, weekly and monthly ppm CO2 mole fraction in dried air. (Some results are from in-situ measurements, others are performed after collection of air in flasks).
Here is a graph showing the analysis difference in ppm between the 2 laboratories on the same day, in situ samples, for year 2020:
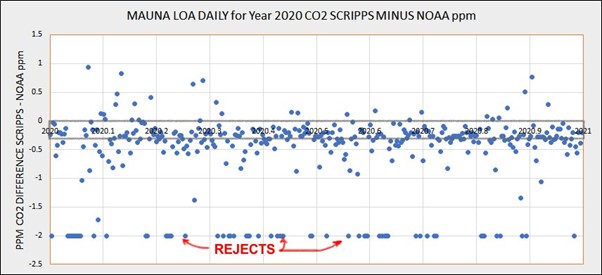
Note that the Scripps results are, on average, some 0.3 ppm lower than NOAA. “Rejects” are discussed below.
For a longer snapshot, here is a similar graph for the weekly results, for years 2017 to 2021 incl., plus the first 3 months of 2022.

An offset of 0.3 ppm persists, to show NOAA to be higher on average. However, these weekly results can scatter about this mean by up to 1.5 ppm, clearly indicating that one lab or the other (or both) is working outside the NOAA-claimed 0.2 ppm accuracy in this example.
There is a pattern to the differences. NOAA is higher in the early and late parts of the year, with Scripps higher in mid-year. This allows an inference that the difference involves seasons and maybe the way that outliers are treated in the lab. NOAA continues to publish this figure and explanation about the way the accept/reject results that do not satisfy defined criteria. (Both Scripps and NOAA appear to employ some form this accept/reject filtering.)
Assuming that normal statistics apply, the weekly figures graphed above would seem to show an overall, useful accuracy more like +/- 0.9 ppm, which is twice the standard deviation of 0.45 for the 275 numbers plotted in the weekly difference graph above. Their mean is -0.29 ppm.
“REJECTS”.
NOAA describe their selection method for treating measurements they consider affected by adverse effects in this already-quoted link:
Global Monitoring Laboratory – Carbon Cycle Greenhouse Gases (noaa.gov)
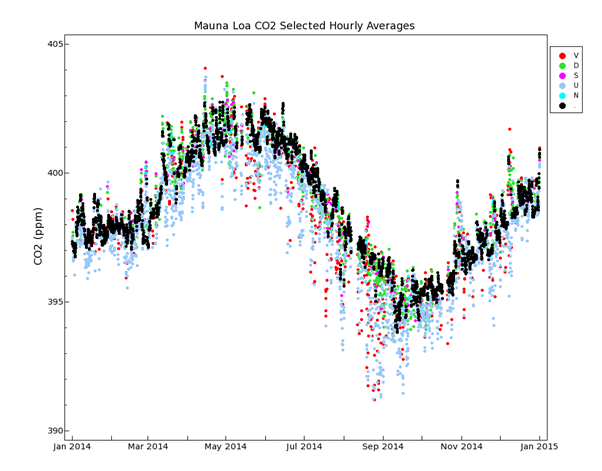
The colour coded dots are defined.
V MEANING: The standard deviation of the 5-minute mole fraction averages should be less than 0.30 ppm within a given hour. A standard deviation larger than 0.30 ppm is indicated by a “V” flag in the hourly data file, and by the red color in Figure 2.
U MEANING: Hours that are likely affected by local photosynthesis (11am to 7pm local time, 21 to 5 UTC) are indicated by a “U” flag in the hourly data file, and by the blue color in Figure 2.
D MEANING: Data where this hour-to-hour change exceeds 0.25 ppm is indicated by a ‘D’ flag in the hourly data file, and by the green color in Figure 2.
S MEANING: After the application of the ‘V’, ‘U’ and ‘D’ flags, there can be times when a single hour remains unflagged, but is bracketed by flagged data. This makes it unclear if this single hour could be representative of background air or not. We therefore apply a ‘S’ flag to these single hours. Pink color.
It is plausible to infer that the difference between Scripps and NOAA arises from the subjective choice at each lab on what to accept and reject, but this is a surmise that would require a purpose-designed inter-laboratory comparison to firm up.
More insight can be gained by examination of the change on CO2 from day to day, sometimes called a “first difference” analysis. The next graph shows NOAA and Scripps again, the same data as above, in first difference daily form.

The distribution of the first difference values is visually different. Scripps seem to have comparatively fewer mid-range values between 1 and 1.5 ppm either side of the zero line. NOAA tends to hug this line, as intuition would suggest it should. Missing data are assigned a value of -2 for graphing purposes here.
Climate researchers in general tend to use more subjectivity than is found in the hard sciences – and it seems to lead to problems.
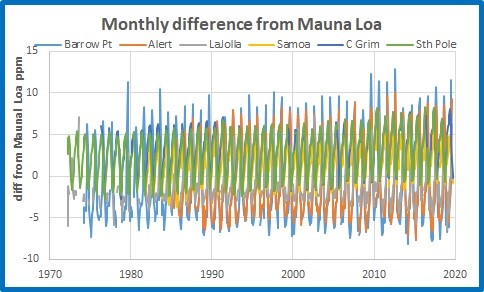
Further to the CO2 uncertainty just shown, normal laboratory procedure would involve the determination of CO2 in dry air by other analytical chemistry methods. In the final analysis, one could compare results at a given time at a number of locations, by a number of different analytical methods, by different operators and by different instruments. This would give (more or less) the ultimate, practical uncertainty – but there would be justified dissent from those who claim to know why there are differences between sites like Point Barrow Alaska, Alert Canada, LaJolla California, American Samoa, Cape Grim Tasmania and the South Pole – all of which have high quality existing analyses for CO2.
Here, from the Kenskingdom blog, is a time series graph of the difference between Mauna Loa CO2 and the others named. By eyeball, the 2 sigma calculation would be about 5.5 ppm at a given time (and increasing).
https://kenskingdom.wordpress.com/2020/06/
In summary, it is said in some papers referenced below that the lockdowns were expected to show a CO2 decrease of about 0.2 ppm over part or all the year 2020, compared to 2019 and/or earlier years. That has to be put into context with the various uncertainties of actual measurements just discussed, with 2 sigma values ranging in ppm CO2 from 0.14 to 0.1 to 0.2 to 0.9 to 5.5 ppm.
It is simply scientifically incorrect to draw conclusions from measurements that are beyond the ability of the measurement process to produce.
……………………………..
SOME ESTIMATES OF LOCKDOWN REDUCTION OF CO2.
Recently, Dr Roy Spencer has examined CO2 changes at MLO during the early Covid Lockdown.
The model match to observations during the COVID-19 year of 2020 is very close, with only a 0.02 ppm difference between model and observations, compared to the 0.24 ppm estimated reduction in total anthropogenic emissions from 2019 to 2020.
……………………………
NOAA has written this.
https://gml.noaa.gov/ccgg/covid2.html
If emissions are lower by as much as 25%, then we would expect the monthly mean CO2 for March at Mauna Loa to be lowered by about 0.2 ppm, and again in April by another 0.2 ppm, etc. Thus, when we compare the average seasonal cycle of many years we would expect a difference to accumulate during 2020 after a number of months. The International Energy Agency expects global CO2 emissions to drop by 8% this year. Clearly, we cannot see a global effect like that in less than a year.
………………………….
Rob Monroe from Scripps offered this analysis dated 3rd May 2021.
Why COVID Didn’t Have a Bigger Effect on CO2 Emissions | The Keeling Curve (ucsd.edu)
The COVID-19 pandemic caused carbon dioxide (CO2) emissions from fossil fuels to drop in 2020 by seven percent compared to 2019. This decrease in emissions slowed the increase in atmospheric CO2 compared to what would have occurred without the pandemic.
It was too small and too brief, however, to stand out strongly in individual CO2 records, such as the Keeling Curve.
In 2020, CCO2 increased by 2.0 parts per million (ppm) at Mauna Loa as concentrations approached 420 ppm. This estimate uses a two-month average centered on Jan. 1, 2021 compared to the similar average one year earlier. The 2020 increase was 22 percent lower than the increase in 2019 of 2.54 ppm, but it was not markedly lower than in other recent years. In 2014, CO2 also increased by 2.0 ppm, and in 2017, CO2 increased by 2.1 ppm. The highest year-over-year growth on record was in 2016, at 3.0 ppm.
……………………………………….
Authors of a November 2020 press release from the World Meteorological Organisation surmised.
Geneva, 23 November 2020 (WMO) – The industrial slowdown due to the COVID-19 pandemic has not curbed record levels of greenhouse gases which are trapping heat in the atmosphere, increasing temperatures and driving more extreme weather, ice melt, sea-level rise and ocean acidification, according to the World Meteorological Organization (WMO).
This WMO conclusion is not justified. It is not known if the Covid reduction could be detected, for reasons given above.
CONCLUSIONS.
It can be seen that the calculated or expected reduction in airborne CO2 from the Covid lockdowns is generally of the order of 0.2 ppm spread over several months in year 2020.
This reduction seems close to – if not smaller than – the uncertainty of the measurements examined here for Scripps and NOAA.
However, there is much uncertainty in the three main parts of this exercise.
1.The reduction in emissions from lockdowns etc is not well known and is usually expressed with many qualifications in papers accessed to date.
2. The airborne fraction of CO2 attributed to emissions from mankind remains speculative between wide bounds.
3. The uncertainty of analysis of CO2 in the atmosphere is uncertain because uncertainty is poorly defined (and often poorly understood) in climate research papers.
Therefore, there is little probability that the effect of lockdowns after Covid-19 on measurements of airborne CO2 will be accurately detected using current published/publicised methods.
END NOTE.
Climate research has a major credibility problem. It is shown when a detailed examination of claims about climate change are examined in detail. There is seldom a proper estimation of precision, error or uncertainty reported. Where these uncertainties are reported, they are very often shown ‘at their best’ with data and methods that would allow proper reporting are downplayed, excused or simply not mentioned.
One poster child for this problem is the so-called “Hockey Stick” of Mann, Bradley and Hughes, 1st April, 1998.
Global-scale temperature patterns and climate forcing over the past six centuries | Nature
Deep analysis by Steven McIntyre and Ross McKitrick , 1st November, 2003 (and later) revealed scientific deficiencies of types similar to the ones reported here for CO2 data.
https://doi.org/10.1260/095830503322793632
Such deficiencies have consequences. Global energy production is currently in turmoil, partly as a consequence of such deficient science. Also, if reductions in airborne CO2 following Covid-caused emission reductions, how are we going to monitor mandated emission reductions?
Authors have to cease and desist from cherry picking, concealment of adverse data, misrepresentation of uncertainty and reluctance to respond to criticisms of their work.


![Tropical Tidbits - [Sat / Aug 28] Hurricane Ida is strengthening rapidly as it approaches Louisiana](https://news7g.com/wp-content/uploads/2021/11/144701_key_messages_sm-390x220.png)