By Andy May
“The atmospheric heat transport on Earth from the Equator to the poles is largely carried out by the mid-latitude storms. However, there is no satisfactory theory to describe this fundamental feature of the Earth’s climate.”
(Barry, Craig, & Thuburn, 2002)
This is the transcript of the talk I gave in Tom Nelson’s podcast interview here.
After Leon Barry and his colleagues write the above statement in their Nature article, they write that the middle latitudes are a zone of strong temperature gradients and these gradients generate storms that can be severe. Their paper proposes that the severity of the storms is proportional to the temperature gradient, such that the smaller the temperature gradient from the tropics to the poles, the fewer severe storms are needed to accomplish the task of transferring excess tropical energy (or heat) to the poles. Keep this concept in mind as I describe meridional (north-south) energy transport.
Much of this talk is based on Javier Vinós’ new book Climate of the Past, Present, and Future, A Scientific Debate, 2nd Edition, Chapter 10. Figure 1, from the book, shows the global average temperature over one average year.

Total solar irradiance (called TSI in Figure 1) constitutes over 99.9% of the energy input into the climate system. The energy received from the sun changes throughout the year by 6.9% due to the constantly changing Earth-Sun distance. The Earth is closest to the sun (perihelion) around the 4th of January and farthest (aphelion) around the 4th of July. Although half the Earth is illuminated by the sun at any given time, the changes in the orientation of Earth’s axis, the irregular distribution of land masses, changes in albedo (or reflectivity), and regional changes in surface and atmospheric temperature, cause important seasonal changes in the amount of reflected solar radiation (called “RSR” in Figure 1) and outgoing longwave radiation (or “OLR”). As a result, the temperature of the Earth is always changing, and the planet is never in thermal equilibrium.
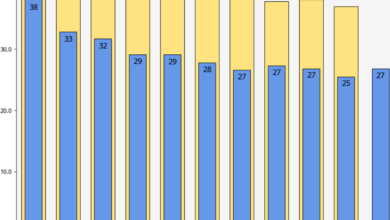
Contrary to what we might expect, the Earth is warmest just after the June solstice, when it is farthest from the sun, and coldest just after the December solstice, when it is receiving 6.9% more energy from the sun. Earth’s average surface temperature is about 14.5°C, which is cold by geological standards, but during the year it warms and cools by 3.8°C, as shown in Figure 1. As expected, Earth emits more energy (called TOR, the red dotted line in Figure 1) when it is cooling and less when it is warming, regardless of what it is receiving at the time. The idea of an energy balance at the top of the atmosphere is clearly wrong. The Earth displays very little temperature variability from year to year, but there is no reason to think we properly understand the mechanisms involved in Earth’s temperature stability. And, certainly, the idea that two-degrees of global warming is dangerous is absurd.
In Figure 1 the global surface average temperature of the planet (the thick black line in Figure 1) changes so much mostly because the Northern Hemisphere (the thin solid black line) varies by 12°C in the average year. The planet has two peaks of energy loss to space (or TOR in Figure 1), these are when each pole is dark and cools. The highest is when the North Pole is dark. Between November and January, the planet emits more energy than at any other time. The Southern Hemisphere is the dashed black line. The 1961–1990 temperature data are from Phil Jones at the Hadley Climatic Research Center. The radiation data are from Barbara Carlson and colleagues.
Figure 1 shows that although the climate system is entirely powered by solar irradiance, what determines Earth’s temperature is what the climate system does with that energy. Yet, the climate system is extremely complex. As Leon Barry and colleagues say in the quote in the beginning of this talk, modern climatology lacks a proper theory of how energy moves within our planet’s climate system. It is possible to model what is not properly understood, but to believe such a model is foolish. Figure 2 shows Earth’s basic energy redistribution processes.

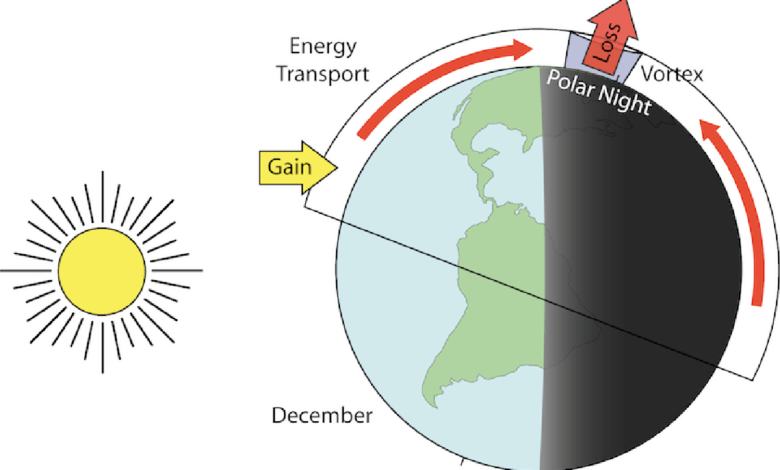
The average absolute (or Kelvin) temperature of the surface does not vary that much with latitude, it lies between 278 and 300 Kelvin between 60°N–60°S. The amount of radiation that Earth’s surface emits is a function of this absolute temperature, the amount that reaches outer space is mostly a function of greenhouse gas concentration and cloud cover, both of which are higher in the tropics, where the higher absolute surface temperatures are. Thus, outgoing longwave radiation does not vary that much with latitude. The result is that the net radiation flux at the top of the atmosphere (TOA) is positive (more incoming than outgoing) on the annual average between about 30°N-30°S and negative between about 30° North or South and the poles, as shown in Figure 2. Obviously, the precise point where the net incoming radiation equals the outgoing varies with the hemisphere, the month of the year, other orbital parameters, and cloudiness, but the average location is near 30° North or South. The cooling, as one moves poleward from the tropics, is mostly from reduced insolation—the amount of solar energy reaching the surface. The reduction in insolation poleward creates a net energy deficit and a latitudinal temperature gradient. Energy is transported from latitudes where there is a net gain of energy (the red area) to latitudes where there is net loss of energy to outer space (the blue area), by meridional transport.
Meridional transport moves a lot more energy towards the winter pole. The winter pole radiates much more energy to space than it receives, since the sun is below the horizon. Virtually all energy the winter pole emits is transported there via winter storms or is latent heat released as summer meltwater freezes.
Without meridional transport, the temperature of the blue regions—where the net flow of energy is toward outer space, that is negative, would decrease continuously until outgoing longwave radiation emissions are sufficiently low to match insolation. In the dark polar night, that temperature would approach absolute zero or –273°C. Meridional transport of air, water vapor, and water in the atmosphere and oceans keeps the temperature of the dark pole much warmer than that.
The Earth’s surface latitudinal temperature gradient is a direct consequence of the latitudinal insolation gradient. Thermal energy flows from warmer regions to colder regions. This is the physical basis of meridional transport, but the climate system is complex, so it is far from a passive process that depends only on the temperature difference between the tropics and the poles. Instead, it is a complex process, that depends upon both geography and climate processes. It is possible to drive more energy with a smaller temperature difference than with a larger temperature difference. As an example, meridional transport has increased in the first two decades of the 21st century, despite Arctic warming, which has reduced the latitudinal temperature gradient. It is not as simple as Leon Barry and colleagues write in their article, but much of what he wrote is correct.

We know that Earth’s latitudinal temperature gradient has varied a lot over the geological past. Wladimir Köppen, a Russian-German scientist, studied the sun-climate effect in the 19th century and established a climate classification system that is still used today. His climate zones are defined in terms of temperature, precipitation, and their seasonal distribution. Many groups of plants and animals are restricted to a narrow range of temperatures; and so are certain geological processes. Using this information, along with well-dated fossils and rock formations from around the world, Christopher Scotese has mapped past climate history, as part of his Paleomap Project. The information allowed him to map the global Köppen climate zones every five million years, since the beginning of the Phanerozoic 540 million years ago. Maps of the Köppen belts as they exist today and 52 million years ago are shown in Figure 3.
Each Köppen belt combination defines a latitudinal temperature gradient. This allows Scotese and his colleagues to create the temperature graphs shown in the right-hand illustration. The graphs can be used to estimate an approximate global average surface temperature for the period. Thus, Scotese and his colleagues have shown that the latitudinal temperature gradient is a fundamental climate variable, an idea that is consistent with the quote from Barry, et al. at the beginning of this talk. Using Scotese’s definitions, the present (21st century) latitudinal temperature gradient is considered a “severe icehouse,” as shown in Figure 3. In the right-hand graph, we compare the current severe icehouse temperature gradient in blue, with the Early Eocene hothouse gradient from 52 million years ago. Notice that today, Greenland and Antarctica are covered in ice, shown in blue on the lower map and the poles are ice free in the upper map. An icehouse climate is characterized by year-round ice sheets at the poles.
The climate during the Early Eocene hothouse was quite warm by today’s standards. The average global surface temperature reached 10°C warmer than today. The so-called “burst of mammalian first appearances” occurred at this time. One of the mammals that first appeared during the Early Eocene was the first primate, our distant ancestor. Primates quickly spread around the world. Besides new mammals, many new genera of turtles, lizards, and plants evolved and thrived during this time. Some deep-water foraminifera went extinct, but most organisms did well and dispersed widely.
The existence of very different past climates on Earth creates an insurmountable problem for modern “consensus” climatology. During the last glacial maximum, 20,000 years ago, the energy received from the sun was the same as now. Not only that, but the Milankovitch orbital parameters were also nearly the same. The distribution of solar energy over the Earth was nearly identical to now, yet the climate was very different. Energy input to the climate system must have been lower because the larger ice sheets reflected more solar energy and the greenhouse effect was lower. The lower greenhouse effect was due to less atmospheric CO2 and available water. Lower temperatures made CO2 more soluble in the oceans, removing it from the air. The very large continental ice sheets in the last glacial maximum removed a lot of water and water vapor and stored it in ice, removing it from the climate system.
A lower energy input and a larger latitudinal temperature gradient ought to have drained the tropics of heat via stronger meridional transport, but that was not the case. There is still controversy about tropical temperatures during the last glacial maximum, but it appears that they were only 1–2°C colder than present. This is consistent with evidence presented by Chris Scotese and colleagues that tropical temperatures have not changed much over the course of the past 540 million years despite huge changes in the average temperature of the planet (9–30°C). You will notice in Figure 3 that the very warm Early Eocene hothouse climate has a similar temperature at the equator to the present day, but the difference at the South Pole is 44°C and it is 23°C at the North Pole. Clearly, most of the warming occurs in the higher latitudes.
If the last glacial maximum creates a problem for how meridional transport operates during a glacial period, the equable climate of the Early Eocene results in a paradox that modern consensus climatology cannot solve. Currently the Earth is in a severe icehouse climate with a very steep latitudinal temperature gradient as the right-hand graph in Figure 3 makes very clear. Currently, temperature falls by 0.6–1°C/°latitude from the equator to the winter pole. Such a cold environment has been relatively rare during the past 540 million years, existing less than 10% of the time. The Early Eocene Earth had an average temperature estimated at 24 to 25°C, that Scotese describes as hothouse conditions. The Early Eocene latitudinal temperature gradient was very shallow, at 0.25–0.45°C/°latitude, with temperatures at the North Pole above freezing all year round, as attested to by the presence of frost-intolerant biota. These hothouse conditions have been even rarer. Over 60% of the Phanerozoic Eon the Earth had an average temperature of 19–20°C. The average global surface temperature of the entire Phanerozoic—the past 540 million years—is a very pleasant 18°C, about 3.5°C warmer than today.
The climate of the Early Eocene is defined as equable. It is characterized by a warm world with a low latitudinal temperature gradient, low seasonality, and fewer mid- and high-latitude storms than today. The failure of modern consensus climate theory to explain these periods has been termed the “equable climate problem.” To reproduce the Early Eocene warm continental interior temperatures and above freezing winter polar regions, models must raise CO2 levels to 4700 ppm, use an implausible climate sensitivity to CO2, and allow tropical temperatures to exceed 35°C. However, the best CO2 estimates for the Early Eocene climatic optimum place probable CO2 levels at 500–1,000 ppm, and the highest estimates are less than 2,000. Further, it is unlikely that tropical temperatures above 30°C are possible, due to the efficiency of heat removal through evaporation and deep convection (the convection of moist air to the upper troposphere) at that temperature. Also, mammals cannot survive above a wet-bulb temperature of 35°C, where they become unable to lose heat. Yet, fossils show us that mammals thrived in the Early Eocene. The highest wet-bulb temperature on Earth today is 30°C, and there is no reason to think it has been higher at any time in the past at places where mammal fossils are found.
The equable climate problem is intimately related to the “low gradient problem.” Conceptually, we believe that to have warm poles more heat must be transported there, especially in winter, to compensate for the insolation deficit. Heat meridional transport is a very important part of the planetary energy budget, and without it the poles would be much colder. But meridional transport depends on the latitudinal temperature gradient since much of the poleward transport in the present climate is through mid- to high-latitude storms resulting from atmospheric instability due to steep temperature gradients. The paradox arises because, while the warm poles of the Early Eocene seem to demand more energy transport, the reduced latitudinal temperature gradient implies reduced meridional transport. It is no wonder that climate models struggle with this conundrum.

The lower atmosphere is a thin film of gas, just 1/600 of the Earth diameter (or about 10 km). This thin atmosphere has the crucial role of always maintaining a land surface temperature compatible with complex life, something it has done for at least the past 540 million years. To do that it must compensate for surface temperature differences arising from differences in insolation. First, it must compensate for the difference between day and night. It does so mainly through the greenhouse effect and clouds, both reduce cooling at night by delaying radiation emissions to space, and clouds reflect incoming solar radiation during the day. Then, it must compensate for the latitudinal decrease in insolation and its seasonal changes due to the axial tilt of the planet. It does this through meridional heat transport.
The three factors responsible for Earth’s thermal stability then are the greenhouse effect, clouds, and meridional transport. Modern climatology ignores the last two and focuses exclusively on the first, by developing the CO2 “control knob” climate hypothesis. The effect of clouds and their variability on climate change is still largely unknown. According the IPCC AR6 report (on page 979) cloud feedback to surface warming could be positive or negative and it is the largest source of uncertainty in the effect of greenhouse gases on the climate.
As you can see in Figure 4, energy is only exchanged between the climate system and outer space through the top of the atmosphere. This means that meridional transport has a net zero value when integrated over the whole planet, since moving energy around does not alter the total energy within the system. This fact has caused many climate scientists to believe that changes in meridional transport cannot cause climate change, probably the most fundamental mistake of modern consensus climatology.
The atmosphere can move a great amount of energy, quickly and efficiently, over the entire surface of the Earth. Most meridional transport is carried out mainly by the atmosphere. Only in the deep tropics (10°S–10°N) is the atmosphere inadequate for the necessary energy transport. This is the region where most solar energy enters the climate system. In this region the ocean must carry out most of the heat transport in the deep tropics. Because the tropical Pacific Ocean is so large—it goes almost half-way around the planet—the El Niño/Southern Oscillation or ENSO manages to keep the tropical heat content under control. El Niño is the way the Earth periodically expels excess accumulated heat that normal meridional transport processes did not carry away. ENSO is a vital part of the global meridional transport system.
Poleward of 10-20° latitude, the ocean transfers most of its energy to the atmosphere, particularly in the western ocean basin boundary currents, like the Kuroshio Current in the Pacific and the Gulf Stream in the Atlantic. Once the sea-ice edge is reached, the transport is essentially carried out exclusively by the atmosphere, since the energy flux through the sea ice is much less than from the liquid ocean surface. The primary mechanism of heat transfer is evaporation, so sea-surface temperature is not as important for ocean-atmosphere energy flow as wind speed and air moisture, since these are the principal factors governing evaporation. However, evaporation limits the maximum sea-surface temperature to about 30°C.
When west-east winds are dominant in the mid- to high-latitudes, meridional or south-north winds, and meridional transport of energy decreases, which causes global warming. When west-east (or zonal) winds decrease, meridional transport increases, more energy reaches the pole, and the planet cools.
Angular momentum is exchanged between the solid Earth–ocean and the atmosphere due to changes in wind direction and speed in the higher latitudes. The changes in angular momentum change the Earth’s rotation speed, which we measure as the length of day. The length of day increases, causing a shorter day, when average zonal (west to east) wind speeds increase. When zonal wind speed increases, the polar vortex becomes stronger, cold air is trapped in the Arctic, and the planet warms.
Zonal wind circulation is stronger in winter, when more angular momentum resides in the atmosphere due to a deeper latitudinal temperature gradient, so the Earth rotates faster in January and July, and slower in April and October, when zonal circulation is weaker. The basic 11-year solar cycle (the Schwabe Cycle) and the ENSO cycle are known to affect zonal versus meridional winds and thus the speed of Earth’s rotation.
But while the role of ENSO is widely known and reported, the role of the sun remains largely ignored. We have found that the sun affects climate through its effect on atmospheric circulation, not through differences in total solar irradiance.

Transport of energy by the atmosphere is linked to the transport of mass, momentum, moisture, and clouds. It mostly takes place in the troposphere. North and south of about 30° latitude energy is mostly transported through storms in preferred routes over ocean basins. The two most significant Northern Hemisphere storm tracks are shown in Figure 5 in red.

Figure 6 shows the correlation between solar activity (shown in red) and average atmospheric angular momentum. The two correlate well and positively from 1920 until today, but they anticorrelate (negative correlation coefficient) prior to 1920. Many solar/climate correlations reversed around 1920, causing much confusion among solar/climate scientists. Prior to 1920, a low sunspot number was thought to cause warmer weather, a negative correlation. After 1920 this relationship reversed, and sunspots correlated positively with warming.
After the 1920 reversal, the idea that there was a connection between the Sun and climate was discredited. The reason for the reversal is unknown and will likely remain so until it happens again. Douglas Hoyt and Kenneth Schatten explain that the reversals appear to happen every 80-120 years, such that 1600 to 1720 produced a negative correlation, 1720 to 1800 a positive correlation, 1800 to 1920 a negative correlation, and 1920 to the present a positive correlation. We might see another reversal within the next few decades, which might allow a mechanism to be discovered.
Knowing how heat is transported into the Arctic allows us to examine the phenomenon of Arctic amplification, that is the idea that when global temperatures rise, they rise faster in the Arctic and Antarctic. General circulation models have predicted this since the first models were written by Syukuro Manabe and Kirk Bryan in the 1960s. However, in the modern global warming period Antarctic amplification has not been observed. Through 1995 so little Arctic amplification was observed, despite intense global warming the previous 20 years, that Judith Curry said:
“The relative lack of observed warming and relatively small ice retreat may indicate that GCMs are overemphasizing the sensitivity of climate to high-latitude processes.”
Curry, et al., 1996

That was about to change that year when Arctic amplification suddenly accelerated, as shown in Figure 7. But the question is still valid. Why was Arctic amplification small before 1996, when intense global warming was taking place, and large after 1996 when the global warming rate decreased—the so-called “Pause?” Modern climatology does not have an answer for that.
In Figure 7, the black curve is the summer (June–August) mean temperature anomaly from the European Weather Center reanalysis database for the region north of 80°N. The red curve is the corresponding winter (December–February) mean temperature anomaly for the same region.
The Arctic in winter constitutes the biggest heat-sink—net loss of energy to space—on the planet. Arctic precipitable water is about 1.5 cm in summer, but in winter it drops to almost zero. As a result, cloud cover becomes lower in winter increasing the energy loss. With reduced cloud cover, almost no water vapor, and no albedo effect, the Arctic in winter has essentially no feedbacks to the greenhouse effect from CO2. Van Wijngaarden & Happer, note that
“the relatively warm greenhouse-gas molecules in the atmosphere above the cold surface cause the Earth to radiate more heat to space from the poles than it could without greenhouse gases.”
Van Wijngaarden & Happer, 2020
Arctic amplification is the consequence of increased meridional transport, not the greenhouse effect. The Arctic has a negative annual energy budget (that is a net flow of energy to outer space) and increasing the greenhouse effect does not make it less negative—that is warming. Arctic warming, particularly during the winter, can only come from an increase in the heat transported from lower latitudes. The increase in Arctic heat transport that is not exported back to lower latitudes is distributed between increased radiation to space and increased downward longwave radiation that warms the surface. The enhanced downward radiation does increase the surface temperature, but due to the low thermal conductivity of ice, and since the heat flux always goes from the warmer ocean to the atmosphere during winter, temperature inversions commonly result, often accompanied by humidity inversions. Thus, the radiative cooling continues from the top of the inversion layer or the top of the clouds, until the water vapor freezes and precipitates, restoring the original very cold condition.
Arctic winter heat transport is enhanced at times when high pressure conditions prevail over the pole leading to a weak or split vortex. Warm air then enters the central Arctic, displacing cold air that moves over the mid–latitude continents producing anomalously cold temperatures and snow. Since Arctic amplification started, the frequency of mid-latitude cold winters has increased, something that models cannot explain. Something similar took place between 1920–40.
Summary of the data
Earth’s global average surface temperature varies 3.8°C every year. The high temperature is in July and the low temperature in January. Thus, it is difficult to take the IPCC warnings about two degrees of warming over the next 100 years seriously.
Earth’s tropics receive much more solar energy than they can radiate to outer space. This sets up many elaborate natural processes to move energy toward the poles where the net flow of energy is to outer space. Changes in this energy flow can cause climate change.
Geologists have devised a methodology that makes use of Wladimir Köppen’s climate belts to reconstruct past global average temperatures. The reconstructions have a very low temporal resolution and only determine one global average surface temperature every five million years, but the process is reasonable. Our present climate is unusually cold in Earth’s history, colder than 90% of the past 540 million years. Temperatures in the tropics do not vary much, global warming or global cooling mainly takes place in the mid- to high-latitude regions.
Storminess increases in periods with a larger latitudinal temperature gradient because most excess tropical energy from the tropics is transported in storms. As global warming reduces the gradient, fewer storms are expected.
Solar activity affects Earth’s climate, but the correlation changes with time. It is sometimes positive, that is Earth warms with increasing solar activity and sometimes Earth cools with increasing solar activity. The switches appear to occur every 80-120 years. The climate/solar correlation changes suggest that the solar effect on climate is not directly due to changes in solar radiation like the IPCC proposes, but to solar induced changes to large atmospheric processes that are being neglected.
Arctic summer temperatures do not change much, probably because any increase in meridional transport simply melts more polar ice. Winter temperatures do change, additional energy transported to the Arctic will warm the surface. When additional ice melts in the summer, due to increased meridional transport, the refreezing of the ice in the winter causes the released latent heat to be sent to space.
Summary of Climate Model problems
The first serious climate model that attempted to show greenhouse gases, especially CO2, that could explain all, or nearly all, of modern global warming was developed in 1979, and published by the National Academy of Sciences. It is usually referred to as the “Charney Report.” In the 43 years since that report was published, the IPCC has published 47 additional reports that reach nearly the same conclusions about CO2 and climate. Yet after writing many tens of thousands of pages and spending billions of dollars, they have not convinced a majority of the people on Earth, or in the United States, that manmade climate change is our most important and serious societal problem. Other societal problems are always considered more important and urgent. In a 2018 Gallup poll climate change ranked 18th, of 19 issues in importance, in a similar 2014 poll, climate change ranked 14th on a list of priorities. A 2022 poll by the Pew Research Center also found climate change ranked 14th. Minds are not being changed.
These models cannot explain why the frequency of Northern Hemisphere cold mid-latitude winters has increased. They cannot simulate the Early Eocene warm conditions without using unrealistic CO2 levels and climate sensitivity to CO2.
They cannot explain why species diversity, especially mammalian diversity, increased in the Early Eocene, when global temperatures were ten degrees warmer. They cannot explain why there was no Arctic warming when global warming peaked between 1980 and 1997, yet it did increase after 1997 when warming slowed.
Further, this seriously dated hypothesis was constructed before the discovery of all the multidecadal ocean oscillations and their connections to solar activity. Considerable evidence has been uncovered since 1979 that climate change is not simply a function of changing greenhouse gas concentrations, but much more complex, with a lot of natural input.
It is especially worrisome that the Early Eocene warming and the current Arctic warming cannot be explained with the IPCC greenhouse gas climate change hypothesis. These problems alone are enough to invalidate the hypothesis. Beating a dead horse comes to mind.
Download the meridional transport bibliography here.
The full Tom Nelson interview can be viewed here.