
Guest “AEUHHH????” by David Middleton
California is about to stumble in the climate fight
BY WENDY WENDLANDT, OPINION CONTRIBUTOR — 01/08/22 11:00 AM EST 1,129THE VIEWS EXPRESSED BY CONTRIBUTORS ARE THEIR OWN AND NOT THE VIEW OF THE HILLUntil recently, when it came to fighting climate change, my home state of California was the undisputed leader among the states.
[…]
A little-known but powerful state agency, the California Public Utilities Commission (CPUC), recently issued new rules for the future of rooftop solar and batteries in California. Simply put, if their proposal is adopted, it would jack up electricity bills for rooftop solar owners to double or triple what they are now. In addition to cutting the “net metering” credit that solar users get paid when they sell their power back to the grid, the CPUC is also proposing a $57 monthly fee for people who install solar.
[…]
California is a climate leader not only by inclination, but also by necessity; the state is a real-time example of the consequences of climate change. Wildfires, heat waves, catastrophic mudslides, blackouts, and drought in the state dominate global headlines; it can be scary to live here.
[…]
Utilities say building new solar farms is a better option — but think for a minute about where those will be built. New farms are already planned for just south of Joshua Tree National Park. The utilities’ preferred route is to declare open season on California’s open spaces.
Yes, we’re going to need utility-scale solar too, to meet our clean energy goals. But the only way to minimize the damage and disruption to California’s expanses and sensitive species is to maximize rooftop solar. Gutting the policies that support it will not achieve that end.
[…]
Wendy Wendlandt is president of Environment America, a national network of 29 state environmental groups working together for clean air, clean water, clean energy, wildlife and open spaces, and a livable climate.
After reading this article, my first thought was…
My second thought was to tackle this paragraph:
California is a climate leader not only by inclination, but also by necessity; the state is a real-time example of the consequences of climate change. Wildfires, heat waves, catastrophic mudslides, blackouts, and drought in the state dominate global headlines; it can be scary to live here.
Wildfires
Particularly striking about California ignitions is the steady increase in number of fires since the early 1900s until a peak c. 1980, followed by a marked drop in fire frequency up to 2016. This happened on both lower-elevation Cal Fire-protected lands and higher-elevation USFS lands, and in most climate divisions (Fig. 6). Despite a significant increase in fires during the first three-quarters of the 20th century, there were marked departures from this linear model, with accelerated ignitions during the 1920s and 1930s and a marked drop in the 1950s and 1960s (Fig. 7). Climate may have had some role in these changes since the former decade was drier and the latter was wetter (Fig S3) and during this period total fires on USFS lands did have a significant climate model largely driven by high summer temperatures and low summer precipitation (Table 4). What is particularly striking is the disconnect between number of ignitions and area burned; during the first three-quarters of the 20th century, although ignitions were increasing, area burned was steadily decreasing through much of the state.
In contrast, since 1980, ignitions have steadily declined, yet area burned has either not changed or, in some northern parts of the state, has increased. In short, the number of ignitions does not directly explain area burned. However, as discussed below, this conclusion does not apply to individual ignition sources, and, in this respect, there may be particular sources worth targeting for fire management purposes.
Factors that may have played a role in these historical patterns of ignitions and area burned are changes in: population density, infrastructure development, fire-prevention success, fire-suppression effectiveness, vegetation-management practices, climate, and possibly record-keeping accuracy. The drivers behind changes in ignition patterns are quite possibly different for different sources, different parts of the state and at different times. First, we consider the patterns for natural lightning-ignited v. human-caused wildfires.
[…]
Throughout California, fire frequency has increased steadily until a peak c. 1980, followed by a marked drop to the present. There was not a tight link between frequency of ignition sources and area burned by those sources and the relationships changed over time. Natural lightning-ignited fires decreased from north to south and from high to low elevation. Throughout most of the state human-caused fires dominated the record and were positively correlated with population density for the first two-thirds of the record, but this relationship reversed in recent decades. Most ignition sources have declined markedly in recent decades with one notable exception, powerline ignitions. One important avenue for future fire hazard reduction will be consideration of solutions to reduce this source of dangerous fires.
[…]
Heat Waves
This study investigates driving factors associated with urbanization, nighttime warming and humidity, ocean dynamics, and droughts that influence heatwaves in Southern California. We show that inland urban heatwaves are rapidly increasing in frequency, duration, and intensity with a greater tendency toward more humid nighttime events—a trend likely to accelerate through the 21st century and linked to human-induced climate change. Coastal and rural areas are less impacted but show a threefold increase in heatwave frequency over the past two decades.
Can you say “Urban Heat Island effect”?
Catastrophic Mudslides
Geologists call these landslides or debris flows.
Like the northern part of the state, southern California is well known to be susceptible to landslides (see Preliminary soil-slip susceptibility maps, southwestern California – Open-File Report 2003-17). Some are triggered by earthquakes, but more frequently landslides are caused by intense and/or prolonged rainfall. Some, but not all, of the major winter storms that have caused landslide fatalities and property damage in southern California have occurred during El Niño (1997-98 info) conditions.
[…]
Shallow Landslides and Debris Flows
Shallow landsides are generally less than (3-5 m) (10-15 ft) in depth and can transform into rapidly moving debris flows. Previous work at the USGS has identified both the areas of southwestern California most susceptible to shallow landslides and the rainfall conditions required to trigger slope failures. Maps displaying where shallow landslides are most likely to occur are based on observation of previous landslide activity, topographic slope, and information on the bedrock material (see Preliminary soil-slip susceptibility maps, southwestern California – Open-File Report 2003-17).
Shallow landslides can occur at any time during the winter, but are more likely happen when the ground is nearly saturated. In southern California, at least 25 cm (10 in) of rainfall during the winter is needed to nearly saturate the ground. After this point, a rain burst of 5-6 mm (0.2 to 0.25 in) in one hour has been observed to trigger abundant shallow landslides (see Landslides in Santa Monica Mountains and Vicinity – Prof Paper 851).
Deep-seated Landslides
Deep-seated landslides are generally greater than 3-5 m (10-15 ft) deep. Deep-seated landslides can be triggered by deep infiltration of rainfall, which can take weeks or months to occur. Some move slowly, while others can move rapidly with little notice. The La Conchita landslide in Ventura County is an example of a deep-seated landslide that has experienced both styles of movement (see Landslide Hazards at La Conchita, California – Open-File Report 2015-1067). In 1995, after an exceptionally wet winter, the landslide moved tens of meters (tens of yards) damaging nine houses. In 2005, after a 15-day period of near-record rainfall, a larger area failed rapidly, remobilizing part of the 1995 slide. The catastrophic movement of the 2005 landslide damaged or destroyed 36 houses and killed 10 people.
Recent Burned Areas
Steep, recently burned areas in southern California are especially susceptible to debris flows (see Southern California–Wildfires and Debris Flows – Fact Sheet 2001-3106). Even modest rain storms during normal, non-El Niño years can trigger post-wildfire debris flows. The USGS has conducted hazard assessments for post-wildfire debris flows for four recent fires in southern CA, as well as numerous fires across the Western U.S. including central and northern California.
[…]
Coastal Cliff Erosion
Many areas of coastal California are subject to cliff erosion and coastal landslides (see new research on El Niño coastal hazards in California). Hazards from these types of landslides can occur both at the bottom of cliffs (from burial) and at the tops of cliffs (from falling over). During the winter season in California, beaches typically erode thereby allowing waves to reach further inland and to inundate the bottoms of coastal cliffs. Wave energy is also typically higher during the winter, and particularly during El Niño events, thereby exacerbating the potential for coastal erosion. Coastal cliff failures may also occur simply as a result of heightened precipitation as well – wave action makes cliffs inherently unstable, and rainfall may be the ultimate trigger for failure, even during times with little to no wave action.
During and just after storms, existing coastal landslides may become reactivated and seemingly stable coastal cliffs may erode and fail rapidly. Background rates of coastal cliff erosion are variable along the California coast (see National Assessment of Shoreline Change Part 4: Historical Coastal Cliff Retreat along the California Coast – Open File Report 2007-1133) and tied to the rock or soil strength of the cliffs among other factors, but these measurements of historic coastal cliff retreat provide indications of places most susceptible to coastal landslides.
California has always had a lot of landslides…
As beautiful as California’s geology is it’s a geologically dangerous place to live.
Blackouts
California’s blackouts aren’t caused by climate change. They’re the result of the state’s fight against climate change.
Drought
Arguably, California’s 2011-2017 drought may have been its worst in 1,200 years. However, NOAA has already concluded that the cause was not climate change.
How severe has the California Drought been?
California statewide precipitation during the last three winters (November-April 2011/2012 through 2013/2014) ranked the second lowest since official measurements began in 1895. Only the consecutive three-year period of 1974/1975 through 1976/1977 was drier. As one critical indication of the cumulative and growing impact of this drought, the September 2014 assessment of statewide water storage was only about 50% of average for this time of year, according to the California Department of Water Resources. Water supply depletion has not resulted from the lack of precipitation alone, but also from very high temperatures with the 2013/2014 winter being the state’s warmest on record.
As the new 2014/2015 wet season commences, the current state of drought as assessed by the US Drought Monitor indicates almost all of California to be experiencing extreme to exceptional drought severity. The situation deteriorated greatly during the past year – the third consecutive year of low precipitation and the driest of the three. Exceptional drought conditions cover over half of the state as of December 4, 2014, whereas one year earlier no regions in the state were considered to be under exceptional drought conditions.
[…]
What factors caused the California Drought?
*Weather conditions were key to explaining the event – a high pressure ridge off the West Coast diverted the track of storms during all three winters, typical of historical droughts.
*West Coast high pressure was rendered more likely during 2011-14 by effects of sea surface temperature patterns over the world oceans.
*The drought’s first year (2011/2012) was likely the most predictable, when La Nina effects largely explained high pressure off the West Coast, though simulations indicate that high pressure continued to be favored due to ocean effects in 2012-14.
Is the California Drought a symptom of long term climate change?
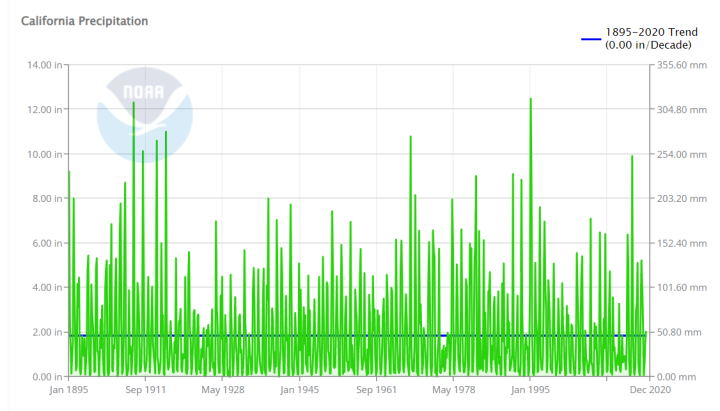
The current drought is not part of a long-term change in California precipitation, which exhibits no appreciable trend since 1895. Key oceanic features that caused precipitation inhibiting atmospheric ridging off the West Coast during 2011-14 were symptomatic of natural internal atmosphere-ocean variability.
Model simulations indicate that human-induced climate change increases California precipitation in mid-winter, with a low-pressure circulation anomaly over the North Pacific, opposite to conditions of the last 3 winters. The same model simulations indicate a decrease in spring precipitation over California. However, precipitation deficits observed during the past three years are an order of magnitude greater than the model simulated changes related to human-induced forcing. Nonetheless, record setting high temperature that accompanied this recent drought was likely made more extreme due to human-induced global warming.
The full report can be accessed here: Causes and Predictability of the 2011-14 California Drought.
The drought conditions actually lasted until 2017. If anyone wants to argue that climate change took over as the cause of the drought after the 2015 NOAA report, please do. I need a reason to use this:

As stated in the report, “The current drought is not part of a long-term change in California precipitation, which exhibits no appreciable trend since 1895.” The data can easily be accessed here: NOAA/Climate at a Glance.
However, it does appear that drought severity may have increased, although the r2 on the PDSI trendline is probably close to the “Dean Wormer Line”…
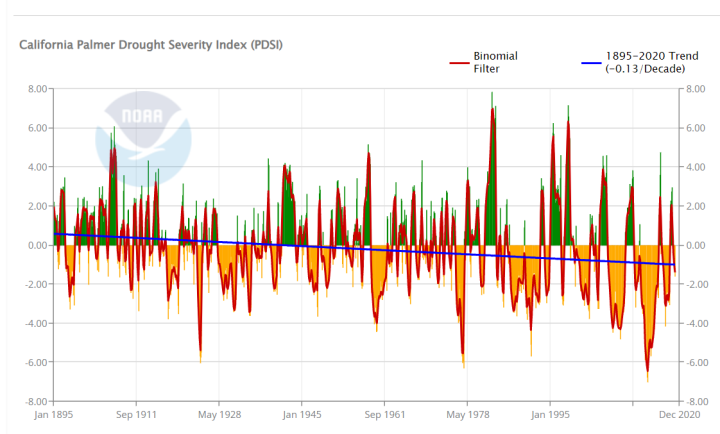
What could cause drought severity to increase, without a decrease in precipitation?
Palmer Hydrological Drought Index: measures hydrological impacts of drought (e.g., reservoir levels, groundwater levels, etc.) which take longer to develop and longer to recover from. This long-term drought index was developed to quantify these hydrological effects, and it responds more slowly to changing conditions than the PDSI.
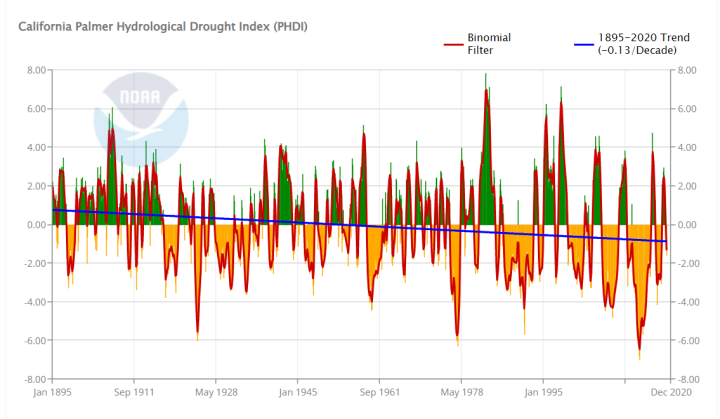
It appears to me that California might just have a water resource management problem, rather than a climate change problem.
“California is about to stumble in the climate fight”
More like, already stumbled…
Whether distributed or utility scale, California has already crammed too much solar power into the grid. California’s “Duck Curve” is becoming more of a Goose Curve.

In 2020, CAISO had to curtail “1.5 million megawatthours of utility-scale solar, or 5% of its utility-scale solar production“, and the problem is getting worse.
While California generates more electricity from solar power than it can consume and/or sell, the state imports nearly 30% of its electricity.
In 2019, California was the fourth-largest electricity producer in the nation, but the state was also the nation’s largest importer of electricity and received about 28% of its electricity supply from generating facilities outside of California, including imports from Mexico.
If Ms. Wendlandt thinks that “it can be scary to live” in California, she should move somewhere safe, because installing more solar panels isn’t going to alter the geology, physical geography, climate, weather or California’s dystopic government… Just, please don’t move to Texas. Austin is full.
Speaking of Duck Curves…
References
Hulley, G. C., Dousset, B., & Kahn, B. H. (2020). Rising trends in heatwave metrics across Southern California. Earth’s Future, 8, e2020EF001480. https://doi.org/10.1029/2020EF001480
Keeley Jon E., Syphard Alexandra D. (2018) Historical patterns of wildfire ignition sources in California ecosystems. International Journal of Wildland Fire 27, 781-799. https://doi.org/10.1071/WF18026
Seager, R., Hoerling, M., Schubert, S., Wang, H., Lyon, B., Kumar, A., Nakamura, J., & Henderson, N. (2015). Causes of the 2011–14 California drought. Journal of Climate, 28(18), 6997– 7024.