by Judith Curry
“The first rule of climate chess is this. The board is bigger than we think, and includes more than fossil fuels.” – Jon Foley
The strategy to limit global warming is tied directly to limiting the amount of CO2 emitted into the atmosphere. Emissions targets are a centerpiece of the UNFCCC Paris Agreement. The goal of the emissions targets is to limit global warming to well below 2, preferably 1.5 degrees Centigrade, compared to pre-industrial levels (typically the baseline period 1851-1900). For reference, the climate has warmed in 2020 by about 1.2oC
Using the medium emissions scenario (SSP2-4.5), the IPCC AR6 constrained global mean temperature projections indicate that there is a 50% chance that the 1.5oC threshold would be crossed around 2030 and the 2oC threshold would be crossed around 2052. There is uncertainty in the year for which the thresholds would be crossed (2026-2042 for the 1.5oC threshold and 2038-2072 for the 2oC threshold), mostly owing to the range of climate sensitivity to CO2 among different models.
This post illustrates now natural climate variability could influence the global mean surface temperature change through 2050, and hence influence the time of crossing the 1.5 and 2.0oC thresholds. Specifically, alternative scenarios of volcanic eruptions, solar variability and internal climate variability are considered. The risk from not realistically accounting for natural climate variability is that critical possible future climate outcomes are being discounted, potentially causing maladaptation. Each of the scenarios presented here is arguably more plausible than the high emissions scenarios RCP8.5/SSP4-8.5 LINK. For additional reference, see also theis previous blog post.
Natural internal variability
Variations in global mean surface temperature are linked to recurrent multi-decadal variations in large-scale ocean circulations. Not taking multi-decadal internal variability into account in predictions of future warming runs the risk of over-estimating the warming for the next two to three decades, when the Atlantic Multi-decadal Oscillation is expected to shift into its cold phase.
While climate models simulate the large-scale ocean circulations and internal climate variability, the magnitude in the multi-decadal band is too low in most models and the phasing of the variability is not synced with the actual, observed climate variations in long-term simulations. Averaging multiple simulations from climate models effectively averages out the internal variations, leaving only the forced climate variability (e.g. CO2 forcing).
Maher et al. (2020) used six single model initial condition large ensembles (SMILEs) for 21st century simulations found that on a 15-year time-scale, surface temperature trend projections are dominated by internal variability, with little influence of structural model differences or the emissions scenario. On a 30-year time-scale, structural model differences and emissions scenario uncertainties play a larger role in controlling surface temperature trend projections. However, even for projections out to thirty years, most of the globe could still experience no warming due to internal variability even with continued CO2 forcing.
So, for the period between 2020 and 2050, will natural internal variability contribute to warming or cooling, relative to the underlying warming trend from emissions? Most analyses have identified the Atlantic Multidecadal Oscillation (AMO) as having the dominant multi-decadal imprint on global temperatures. It has been estimated that there is a peak-to-trough impact of the AMO on global mean surface temperatures of 0.3 to 0.4oC The climate has been in the warm phase of the AMO since 1995; hence in 2021 it has been 26 years since the previous shift. Analysis of historical and paleoclimatic records suggests that a shift to the cold phase of the AMO should occur within the next 12 years (by 2032), with a 50% probability of the shift occurring in the next 5 years (by 2026).
While we are currently in the warm phase of the AMO, we are past the peak of the warm phase. Hence we consider the following three scenarios for the contribution of multi-decadal internal variability to global mean surface temperature change averaged for the period 2021-2050:
- The None scenario (0oC) assumes no net impact of multidecadal internal variability on the global mean surface temperature, which is implicit in constrained projections of the IPCC AR6.
- The Moderate scenario (-0.2oC) assumes a shift to the cool phase of the AMO in the 2030’s with a moderate impact;
- The Strong scenario (-0.3oC) assumes a shift to the cool phase of the AMO in the 2020’s with a stronger impact.
The Moderate and Strong scenarios are contingent on the assumptions that the AMO is the primary driver of multi-decadal internal climate variability and that a shift to the cold phase of the AMO is expected in the next decade. Other facets of multi-decadal and decadal scale internal variability could come into play over the next three decades, but these scenarios illustrate the magnitude of plausible outcomes over the next three decades.
While the scenarios presented here focus on cooling over the next three decades, it is noted that the same reasoning leads to the expectation that internal variability will contribute to warming during decades in the 2nd half of the 21stcentury.
Volcanoes
The instrumental period covering the past 150 years has been relatively quiet with regards to volcanic eruptions, and thus it is tempting to ascribe potential volcanism a minor role in future climate projections. However over the past two millennia, there have been periods with considerably stronger volcanic activity. Clusters of strong tropical eruptions have contributed to sustained cold periods such as the Little Ice Age.
Explosive volcanoes are omitted from scenarios used for future climate projections, because they are unpredictable. Due to the direct radiative effect of volcanic aerosol particles that reach the stratosphere, large volcanic eruptions lead to an overall decrease of global mean surface temperature, which can extend to multi-decadal or even century timescales in the case of clusters of large volcanic eruptions. (see IPCC AR6 Cross-chapter Box 4.1)
Explosive volcanic eruptions of the magnitude of the 1991 Pinatubo eruption or larger have occurred on average twice per century throughout the past 2500 years. (Sigl et al., 2015). About 8 extremely explosive volcanic eruptions (more than 5 times stronger than Pinatubo) occurred during this period. The largest of these are Samalas in 1257 and Tambora in 1815, the latter resulting in “the year without a summer” with harvest failures across the Northern Hemisphere (Raible et al., 2016). It has been estimated that a Samalas-type eruption may occur 1-2 times per millennium on average.
Given the unpredictability of individual eruptions, the CMIP5/CMIP6 climate model simulations either specify future volcanic forcing as zero or a constant background value (Eyring 2016). The background value used in the CMIP6 simulations has been estimated from the historical record 1850. Background estimates of volcanic cooling determined from climate models range from 0.1oC (Bethke et al. 2017) to 0.27oC (Fyfe et al. 2021), the differences arising from model structural differences.
The IPCC AR6 states that it is likely that at least one large eruption will occur during the 21st century. The AR6 further acknowledges that a low likelihood, high impact outcome of several large eruptions would greatly alter the 21st century climate trajectory compared to emissions-based projections. (Cross Chapter Box 4.1) How much cooling could happen from explosive volcanic eruptions in the 21st century? A cluster of explosive eruptions such as happened in the first half of the 19th century is estimated to have caused 0.5oC cooling averaged over several decades. (Figure 7.8 IPCC AR6)
This analysis considers three scenarios of volcanic cooling for the 21st century:
- Low Baseline scenario, equivalent to a weak response to the average volcanic forcing over the historical record since 1850, estimated at -0.1oC;
- High Baseline scenario, estimated at -0.27oC;
- Extreme Cluster of volcanoes, analogous to the explosive eruptions that occurred during 1810-1840, estimated to have caused a decadally-averaged cooling of -0.5oC
Solar variations
A detailed analysis of the rationale for selecting scenarios of solar variations is described an a recent blog post LINK
There are several reasons to expect lower solar activity during the 21st century, relative to the 20th century. The recently completed solar cycle 24 was the smallest sunspot cycle in 100 years and the third in a trend of diminishing sunspot cycles. Some solar physicists expect cycle 25 to be even smaller than Cycle 24. Further, a grand maximum is more likely to be followed by a grand minimum than by another grand maximum. Empirically-based projections imply a new solar minimum starting in 2002–2004 and ending in 2063–2075. It has been estimated that there is an 8% chance of the Sun falling into a Grand Minimum during the next 40 years. However, the depth and length of a phase of low solar activity in the 21st century is largely uncertain.
If the Sun did fall into a minimum during mid 21st century of the magnitude of the Maunder Minimum, how much cooling could we expect? Estimates from climate models and other analytical models expect the cooling to be small, ranging from 0.09 to 0.3oC. These models assume that solar-climate interaction is limited to TSI forcing alone.
Recent research suggest that solar indirect effects could amplify an anomaly in solar insolation by a factor of up to 3-7. If such an amplification factor is included, then a surface temperature decrease of up to 1oC (or even more) from a Maunder Minimum could occur.
In light of these considerations, three scenarios for solar variability in the mid 21st century are considered here:
- CMIP6 Reference scenario: approximately -0.1oC
- Intermediate: -0.3oC, corresponds to high Maunder minimum estimate without amplification effects, or a weaker minimum with amplification effects
- High: -0.6oC, a low solar scenario (which is not a Maunder Minimum) with amplification by solar indirect effects
Global surface temperature projections to 2050
Synthetic scenarios building upon historical and paleo data, climate model outputs, process models and storylines based on physical reasoning provide a broader range of outcome scenarios than global climate model simulations, particularly with regards to natural climate variability.
The scenarios presented in the previous subsections are integrated here to assess how natural climate variability could change our expectations for the amount of warming expected by 2050, in particular the years in which the 1.5 and 2.0oC thresholds will be crossed. All of the scenarios of natural variability considered here point in the direction of cooling through 2050, for reasons justified in the preceding subsections.
This analysis adopts the SSP2-4.5 emissions scenario as the most likely scenario to 2050 [LINK], based on analyses by the IEA.
The final integral temperature change is the sum of temperature changes driven by:
- SSP2-4.5 emissions – 3 scenarios that span the AR6 likely range (+1.6, +2.0, +2.5oC), referenced to the baseline period 1851-1900
- Volcanoes – 3 scenarios relative to a nominal baseline of -0.1oC in the CMIP6 simulations (0, -0.17, -0.4 oC), referenced to a baseline of 2020
- Solar – 3 scenarios relative to a nominal baseline of -0.1oC in the CMIP6 simulations (0, -0.2, -0.5 oC), referenced to a baseline of 2020
- Natural internal variability – 3 scenarios (0, -0.2, -0.3 oC), referenced to a baseline of 2020
With four sources of variables and three scenarios for each variable, we can produce a total of 81 scenarios by adding combinations of scenarios inputs for the individual variables. Three of these outcome scenarios correspond directly to the AR6 values associated with SSP2-4.5, while the others include some combination of the scenarios of natural climate variability.
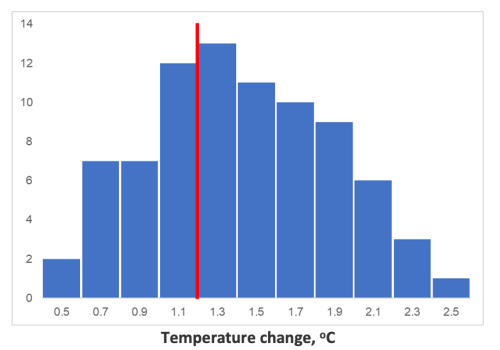
Figure 1 shows a histogram of the 81 different scenario outcomes. The outcome frequencies are indicated on the y-axis. For reference the temperature in 2020 is 1.2oC above the 1851-1900 baseline, which is indicated by the red vertical line. The scenario with the most warming is 2.5oC, which corresponds to the upper bound of the likely range from the AR6 (with no additional impacts from natural variability). The scenario with the lowest amount of warming is 0.4oC, which corresponds to the lower bound of the AR6 likely range with the most extreme scenario for each of the components of natural variability – this extreme outcome scenario for 2050 is 0.8oC cooler than the temperature in 2020.

Temperature change, oC
Figure 1. Distribution of scenarios of global temperature change for 2050, referenced to a baseline of 1851-1900. The vertical red line corresponds to 1.2oC, representing the warming to 2020. The y-axis is frequency of outcomes, based on 81 scenarios.
There is weak justification for providing likelihoods of the individual outcomes. While each of these scenario outcomes is arguably plausible, the distribution of outcomes in Figure 1 does not in any way reflect the probability of the outcomes. Are some of these scenarios more likely than others? Selecting the intermediate scenario for each variable produces an outcome scenario of +1.43oC, indicating that we would not cross the 1.5oC threshold before 2050 (compared to an expected crossing circa 2030 using the AR6 best estimate for SSP2-4.5). It is seen in Figure 1 that for the intermediate scenario outcomes between 1.0 and 2.0oC, there are multiple pathways to the same temperature outcomes, supporting a greater likelihood for these intermediate outcomes. However, judgment about the likelihood of individual outcomes rests on the assessment of the likelihood of the individual input scenarios.
All of the components of natural variability point to cooling during the period 2020-2050. Individually these components are not expected to be large in the moderate scenarios. However when summed, their magnitude approaches, or could even exceed, the magnitude of the emissions-driven warming for the next three decades. The odds of all three natural variability inputs maintaining at the IPCC baseline levels to 2050 seems low to me.
Studies using global climate models to assess the probability of decades in the 21st century being characterized by net cooling have mostly focused only on natural internal variability (Maher et al. 2020 Knutson et al..2016), with a single study that I’m aware of that considers volcanic eruptions plus internal variability (Bethke et al. 2017). Volcanic-induced cooling becomes increasingly important in facilitating neutral or negative temperature trends on longer timescales, in conjunction with natural internal variability effects. Several studies have addressed the combination of internal and solar variability LINK Apart from the ‘wild card’ of volcanic eruptions, the big uncertainty is solar indirect effects. The growing likelihood of a solar minimum of some magnitude during the mid 21st century emphasizes the need for a resolution to the debate over low versus high variability solar reconstructions, and improved understanding of solar indirect effects.
The bottom line is that uncertainty in global temperature projections to 2050 is skewed towards lower values, as uncertainty in near term scenarios of emissions is decreasing. The confluence of cooling contributions from solar, volcanoes and natural internal variability during the period 2020-2050 could extend by decades the time horizon for keeping the global mean surface temperature below the thresholds of 1.5 and 2.0oC. This extension has important implications for the urgency of emissions reductions and planning for geoengineering interventions.
The targets of 1.5 and 2oC are easy to measure and communicate, and have been effective at galvanizing political will and public support. However, these targets are vague approximations to some of the dangers of climate change and mis-represent the nature of the scientific knowledge upon which these numbers are claimed to rest. (Hulme, Fetishizing the number) These targets have arguably become a “fetish” that exert excessive power over our imagination of the climatic future, narrowing our policy options and directing our policy making. Further, these targets encourage goal displacement (Jerry Muller, The Tyranny of Metrics), which occurs when attention becomes focused on hitting the target while obscuring the real reasons why we are concerned about climate change in the first place – the wellbeing of humans and ecosystems.